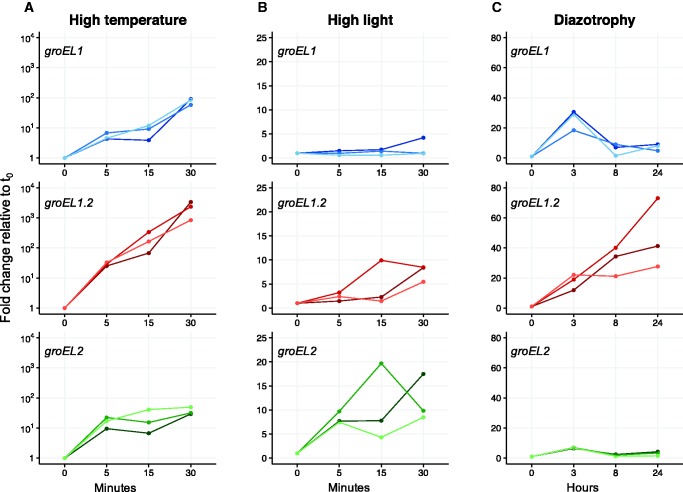
Fig. 2.—
Relative transcript abundance of the groEL paralogous genes in C. fritschii PCC 6912 under different growth conditions. Three independent biological replicates are plotted. (A) High temperature (50 °C). (B) High light (70 µE m−2 s−1). (C) Diazotrophy (nitrogen deprivation). Transcript abundance is depicted as fold change relative to expression levels under standard growth condition (37 °C, 24 µE m−2 s−1).

