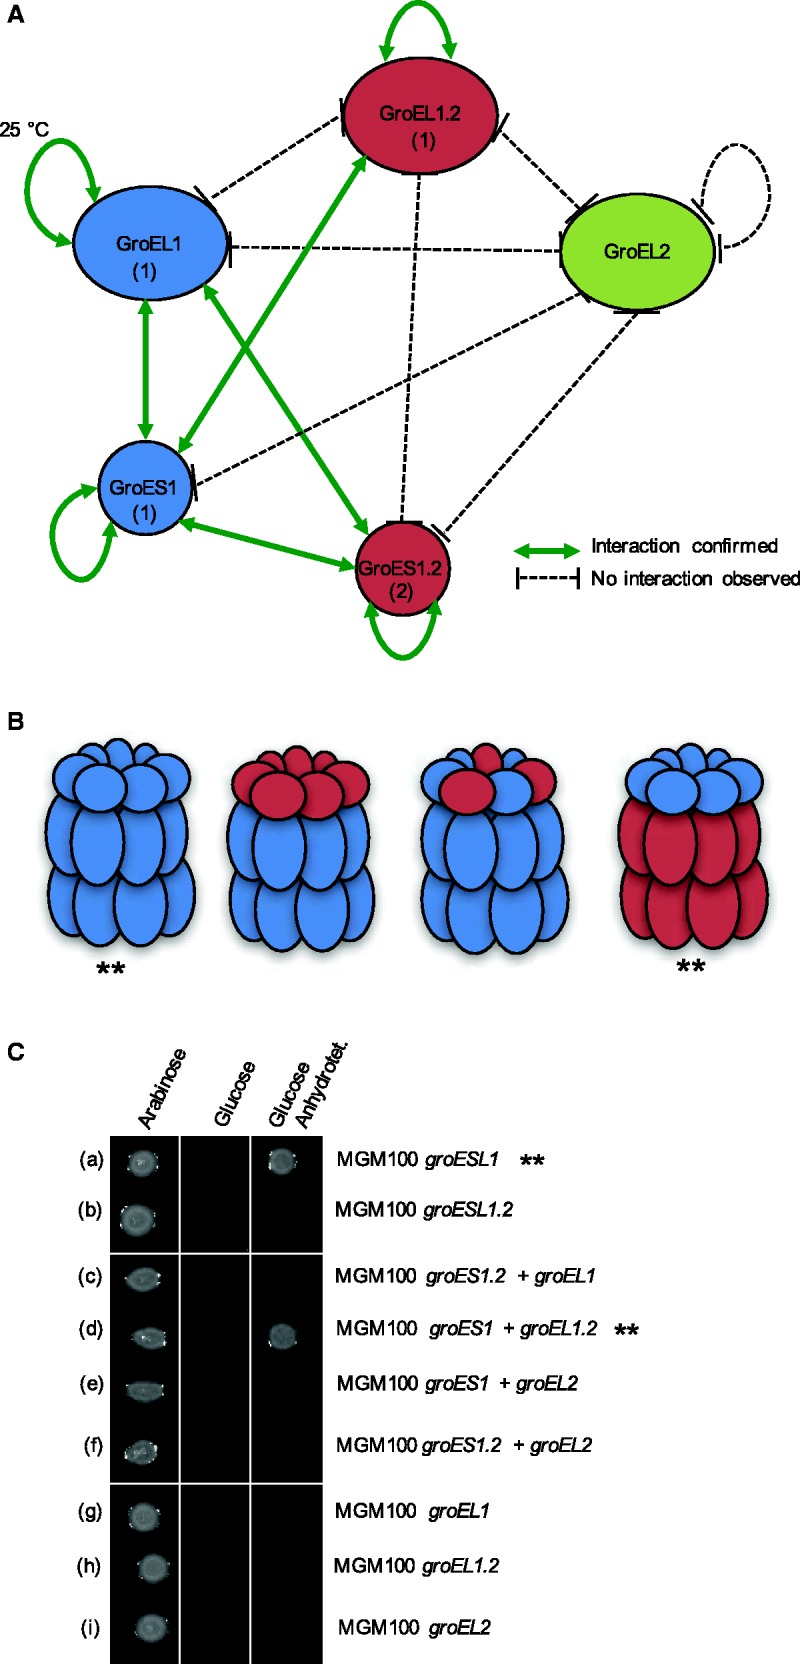
Fig. 4.—

Protein–protein interaction and complementation assay. (A) Protein–protein interaction network of GroEL/GroES paralogs in C. fritschii PCC 6912. Interaction was tested by bacterial two-hybrid assay with either N- or C- terminally tagged proteins. Screening of positive interaction confirmed by a β-galactosidase assay (supplementary fig. S5, Supplementary Material online). The subunits are marked with (1) if the interaction was observed with both C- and N-terminal tagged proteins or (2) if the interaction was observed only with C-terminal tagged proteins. (B) Schematic diagram of putative chaperonin complexes based on the protein–protein interaction network. Chaperonin complexes that perform functional complementation in E. coli MGM100 are marked with **. (C) Complementation assay in the groEL deficient E. coli strain MGM100. Plating on arabinose constitutes a positive control (induction of the native E. coli groESL operon) whereas plating on glucose constitutes the negative control. Anhydrotetracycline induces the expression of the different cyanobacterial groES and groEL paralogs (as indicated on the right side). Combinations that compensate the lack of the native groESL are marked with **.
