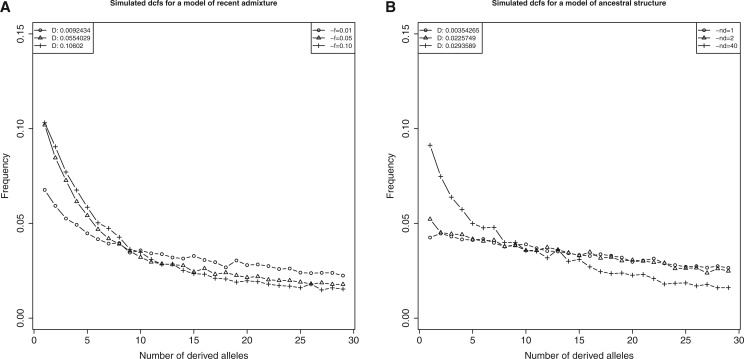
Fig. 2.—
Simulated dcfs for models of constant Ne, n = 50 chromosomes (number of alleles only shown up to n = 30). (A) Model of recent admixture and no ongoing gene flow for three different values of admixture rate f. (B) Similar setting for the model of ancestral structure, shown for three different values of nd with mm = 6. Values of D statistics are given in the upper left corner.

