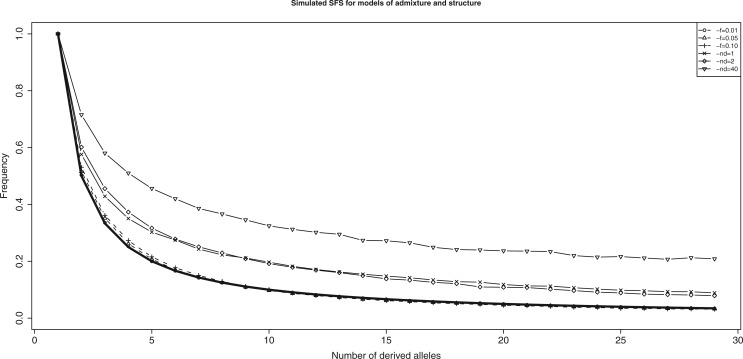
Fig. 3.—
Simulated derived allele SFS (normalized by the frequency of singletons) for sites in p 2 not being dependent on the allelic state in p 3 for a model of constant Ne, n = 50 chromosomes and no ongoing gene flow (number of alleles only shown up to n = 30). Thick solid line is the expected SFS . Solid lines denoted by parameter nd represent the SFS for sites simulated under the model of ancestral structure, dotted lines denoted by parameter f represent the SFS for sites simulated under the model of recent admixture.

