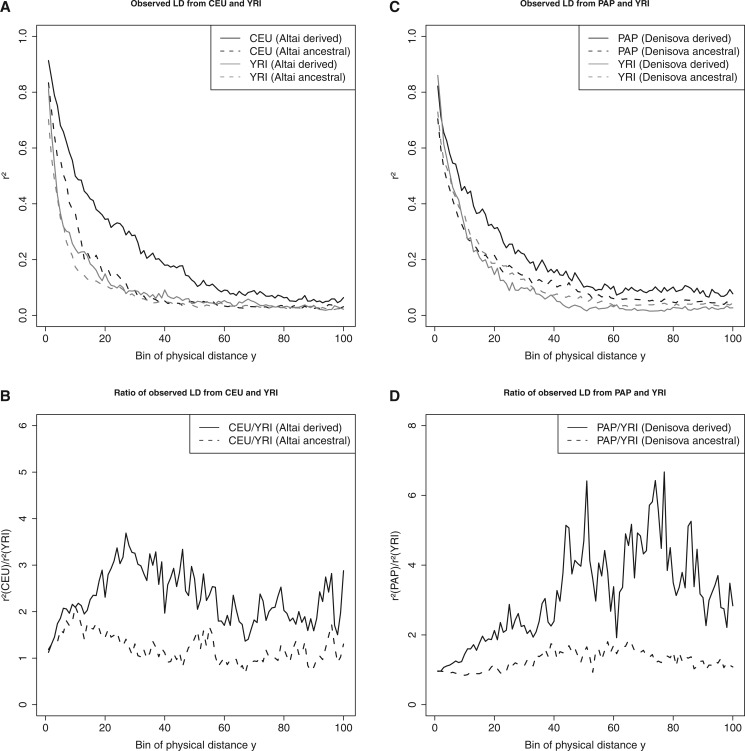
Fig. 6.—
Observed r 2 from the 1000 Genomes Project phase 3 data set and Melanesian individuals. (A) Pairwise r 2 calculated in the same way as in figure 4A–D for sites from 25 CEU and 25 YRI individuals. Distance between sites was , divided into 100 bins. Panel (B) shows the ratio of r 2 between CEU and YRI. Solid and dotted lines represent r 2 for sites that show the derived and ancestral allele in the Altai individual, respectively. Panels (C, D) show the same analyses but based on 25 Melanesian (PAP), 25 YRI and one Denisova (archaic) individuals, respectively.

