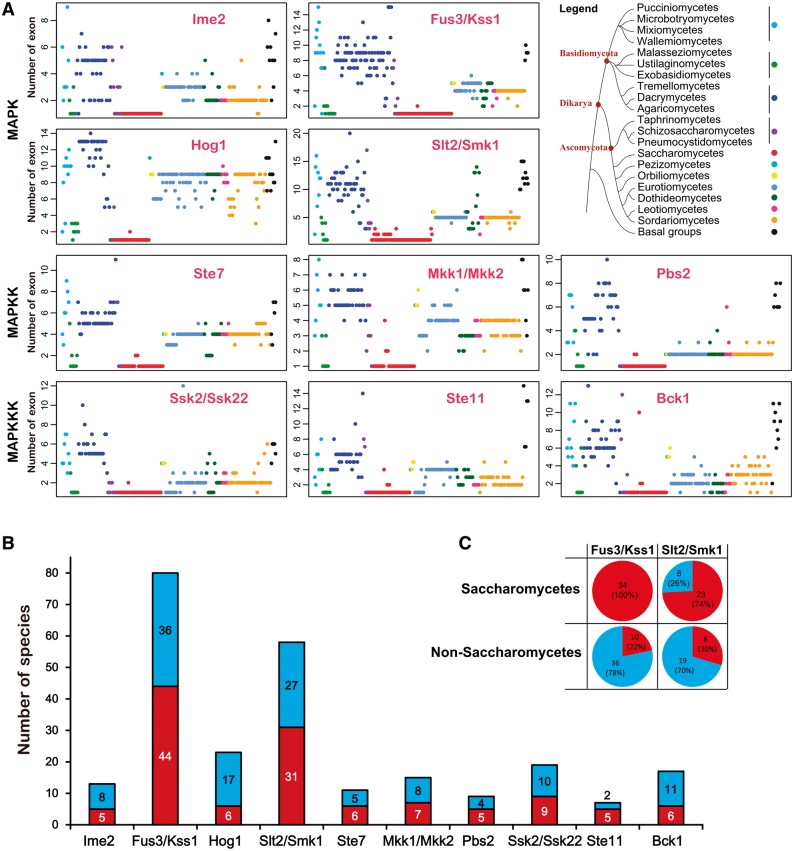
Fig. 7.—
Diversification of the gene structure of MAPK cascade CDSs. (A) The number of exons in all MAPK cascade components. In each subfamily, the 231 fungal species were organized according to their lineage status shown in the legend. For example, a red dot shows the number of exons in a gene from a Saccharomycetes fungus. (B) Stacked bar charts show the gene structure diversity among members of a subfamily. The digit within a bar shows the number of fungal species that demonstrate a difference (blue) or no difference (red) in gene structure among multiple subfamily members. (C) The diversity in gene structure among members within the Fus3/Kss1 or Slt2/Smk1-MAPK subfamily from Saccharomycete fungi (upper panel) and non-Saccharomycete fungi (down panel). The digits within the pie denote the number of fungal species with a difference (blue) or no difference (red) in gene structure among members of the Fus3/Kss1 or Slt2/Smk1-MAPK subfamily.

