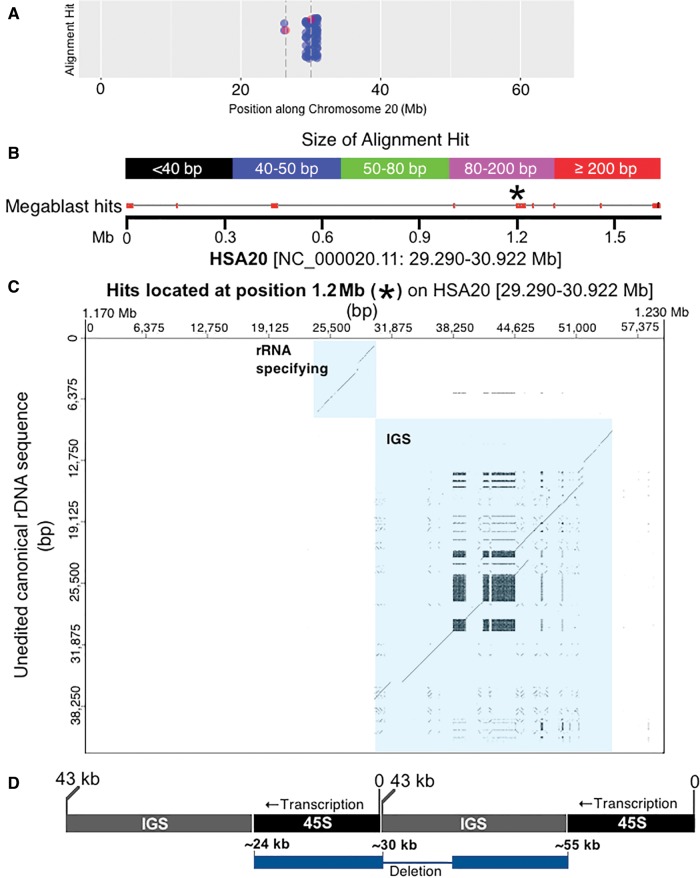
Fig. 5.—
Identifying highly degraded rDNA units in regions far removed from rDNA arrays. (A) A closer look at the HSA20 data shown in figure 4; blue dots indicate megablast hits, red dots with accompanying dashed vertical bars indicate centromere thresholds. (B) The 1.6 Mb that contributes most to the assemblage of megablast hits present near the centromere at HSA20. The image is modified from the output produced by BLAST (Altschul et al. 1990; Camacho et al. 2009). Megablast hits are indicated along the 1.6-Mb and color coded according to size. The genomic coordinates for 1.6 Mb of sequence are also provided. (C) A closer look at the megablast hits present at the 1.2-Mb position of the entire 1.6 Mb region using a dot plot. The ∼80 kb of sequence at 1.2 Mb is compared with the canonical rDNA unit. Using a sliding window size of 50/100 bp, there is a strong indication that this region along the 1.6 Mb of HSA20 contains a highly degraded rDNA unit [see diagonal lines that are highlighted in blue, and which represent matches for the rRNA specifying and spacer region (IGS) of canonical rDNA]. (D) The dot plot shows two diagonal lines as an artefact of which base in the repeated array is counted as “zero”. Since we use the standard base numbering scheme, the real sequence is artificially split. The diagram illustrates where the sequences align within a repeated array. Array is shown in black/gray. Pseudogene is shown in blue. The diagram in (D) is not to scale.

