
Fig. 6.—
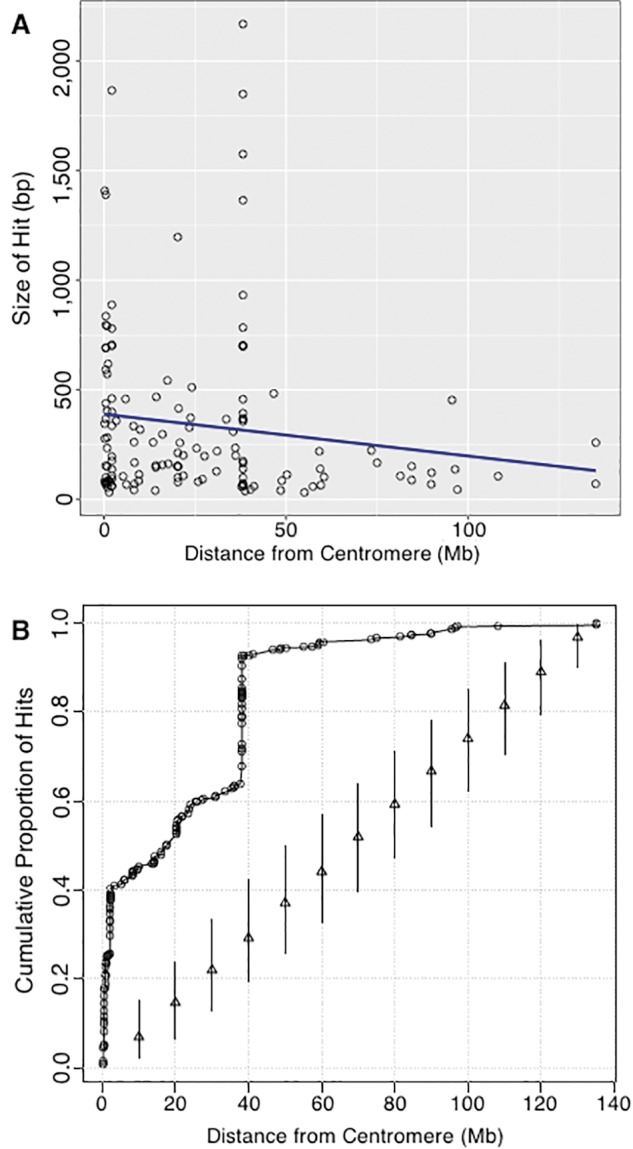
Determining if rDNA megablast hits occur closer to centromeres. (A) Size of megablast hits presented in figure 4 relative to their distance from centromeres. Black open circles represent Megblast hits and a linear trend-line is indicated in blue. (B) The cumulative proportion of megablast hit sites as a function of distance from centromere [black open circles]. For comparison, the cumulative proportions were calculated for 1,000 random assignments of the observed hit counts to locations randomly generated from a uniform distribution. Triangles indicate median cumulative proportions and vertical lines give the 2.5th and 97.5th percentiles of the cumulative proportions over random draws.