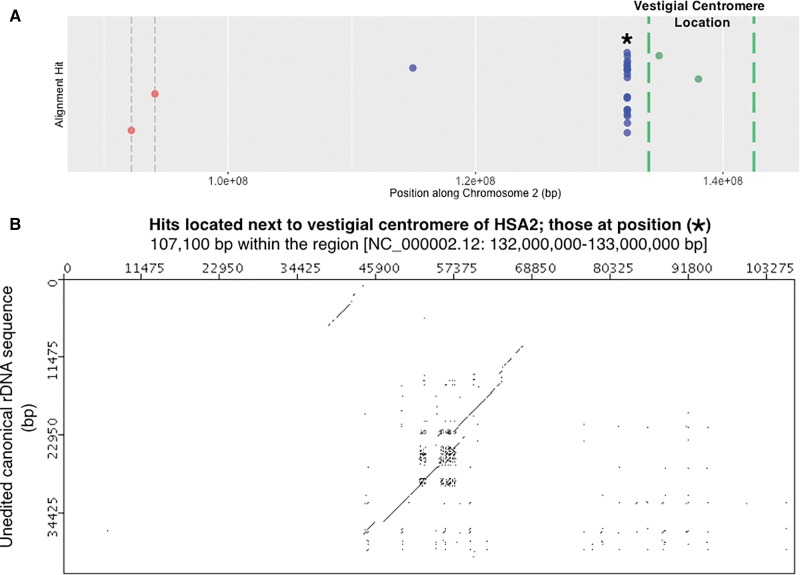
Fig. 7.—
Highly degraded rDNA unit present near vestigial centromere on HSA2. (A) Detail of the HSA2 panel from figure 4. The region shown is a close up of sequence to the right of the active centromere and extending to the edge of the vestigial centromere. Megablast hits [blue dots], HSA2’s active centromere [red dot with dashed gray vertical bars] and HSA2’s vestigial centromere threshold [dashed green vertical bars] are indicated along HSA2. The vestigial centromere threshold corresponds to 2q21.3 to 2q22.1 loci (Avarello et al. 1992; Baldini et al. 1993). Because this threshold is a best estimate of cytogenetic banding locations, two gene positions are also plotted as controls: HNMT [Gene ID: 3176] that occurs in 2q22.1 and ACMSD [Gene ID: 130013] that occurs in 2q21.3 [according to the Entrez Gene Database at NCBI]. (B) Megablast hits located at “*” in panel A, and which are associated with a degrading rDNA unit. About 107 kb have been subsampled from the 1 Mb surrounding the high number of hits in panel A. Similar to figure 5C, diagonal lines produced at a sliding window size of 50/100 bp indicate matches to rRNA specifying and IGS rDNA sequence.

