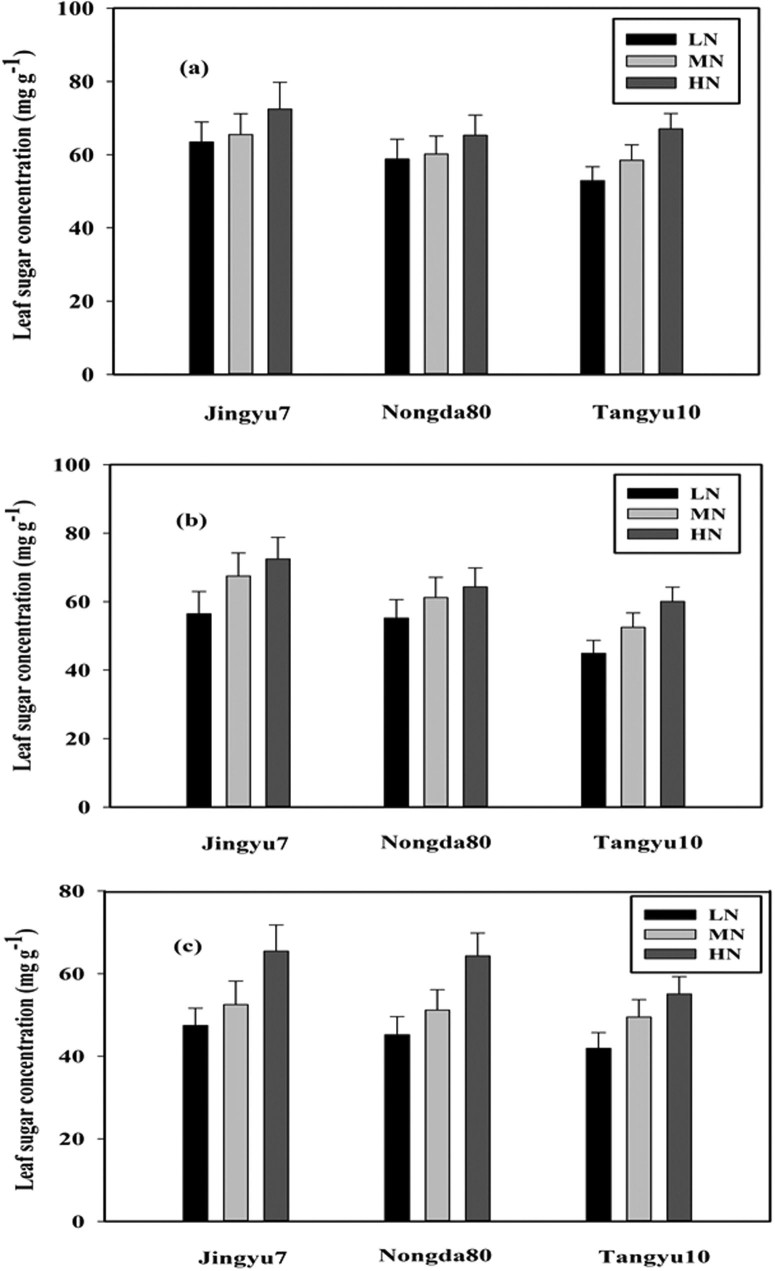
Figure 1. Leaf dry weight for August 16th (a), September 6th (b), and September 17th (c) of corn subjected to low (LN, 0 kg N ha−1), medium (MN, 75 kg N ha−1), and high (HN, 150 kg N ha−1) levels of N over the growing season (2002 and 2003).
Data are the average values across 2 years with ± one standard error (vertical bars). Analysis of variance (ANOVA) results for (a) August 16th: nitrogen (N), P < 0.004; corn cultivars (C), P < 0.045; N × C, P = 0.271; (b) September 6th: N, P < 0.002; C, P < 0.009; N × C, P = 0.145; (c) September 17th: N, P < 0.036; C, P < 0.043; N × C, P = 0.345.

