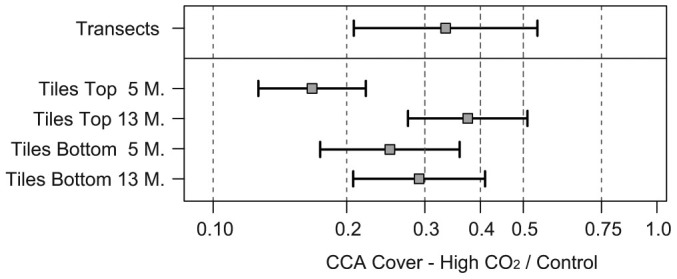
Figure 2. Log ratios of the cover of crustose coralline algae (CCA) at High CO2 over Control sites, on the three reefs (Reef Communities, N = 80 transects), and on the top- and bottom-sides of the settlement tiles after 5 and 13 months of deployment (5.M, 13.M; N = 120 and 116, respectively).

Squares indicate back-transformed means, the error bars are 95% confidence intervals (Supplementary Table S3). For example, the ratio 0.3 indicates the mean cover at High CO2 is 30% of that at the Controls. Differences are all significant at the 5% level (error bars do not include the value 1.0).
