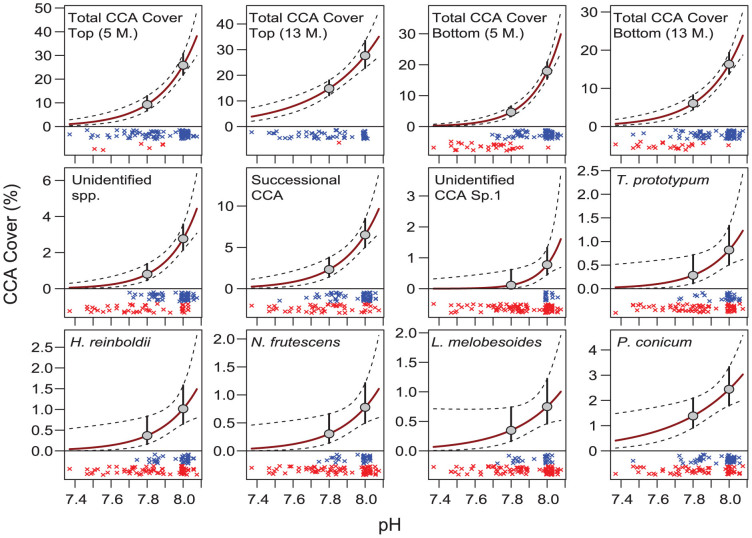
Figure 4. Changes in the cover of various taxonomic groups of CCA along the pH gradient (Supplementary Table S4).
Top row: total CCA cover (all CCA taxa combined), on the top- and bottom-sides of the tiles after 5 and 13 months deployment (5 M., 13 M.; N = 120 and 116, respectively). Middle and bottom row: changes in cover of specific CCA taxa on the bottom-sides of the tiles after 13 months. The red solid lines show the estimated cover as a function of pH, dashed lines show upper and lower 95% confidence intervals. The grey dots and vertical bars show mean cover at a pH level of 8.0 and 7.8, and the 95% CI of these estimates. The ‘x’ symbols (jittered vertically for clarity) show the pH of the individual tiles on which the specific CCA taxa were present (blue) or absent (red).

