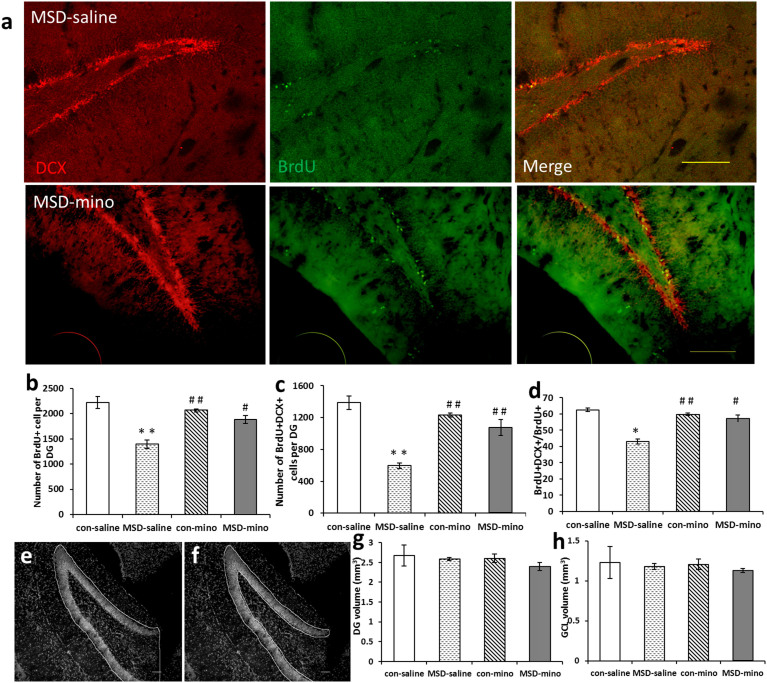
Figure 2. MSD induced changes in neurogenesis in hippocampus of young offspring and impact of minocycline administration.
(a) Representative images of BrdU and DCX labeled cells in the DG of hippocampus, arrow represent the merged images. The total number of BrdU+ cells (b), the number of BrdU+/DCX+ cells (c) and the percentage of BrdU+/DCX+ out of all BrdU+ cells (d) were reduced in the MSD young offspring rats. After minocycline treatment, the total number of BrdU+ cells, the number of BrdU+/DCX+ cells and the percentage of BrdU+/DCX+ out of all BrdU+ cells were increased. Representative figures of the volumes of DG (e) and the GCL areas (f). (g) The volume of DG was not altered in young offspring rats. (h) MSD-mino did not change the volume of GCL subregion in young offspring. * P < 0.05, ** P < 0.01 vs. the control-saline. # P < 0.05, # # P < 0.01 vs. the MSD-saline. Values are the mean ± SEM. Scale bars: A: 20 μm; E, F: 10 μm.

