
Figure 5. Thermostability and cooperativity of hUGP.
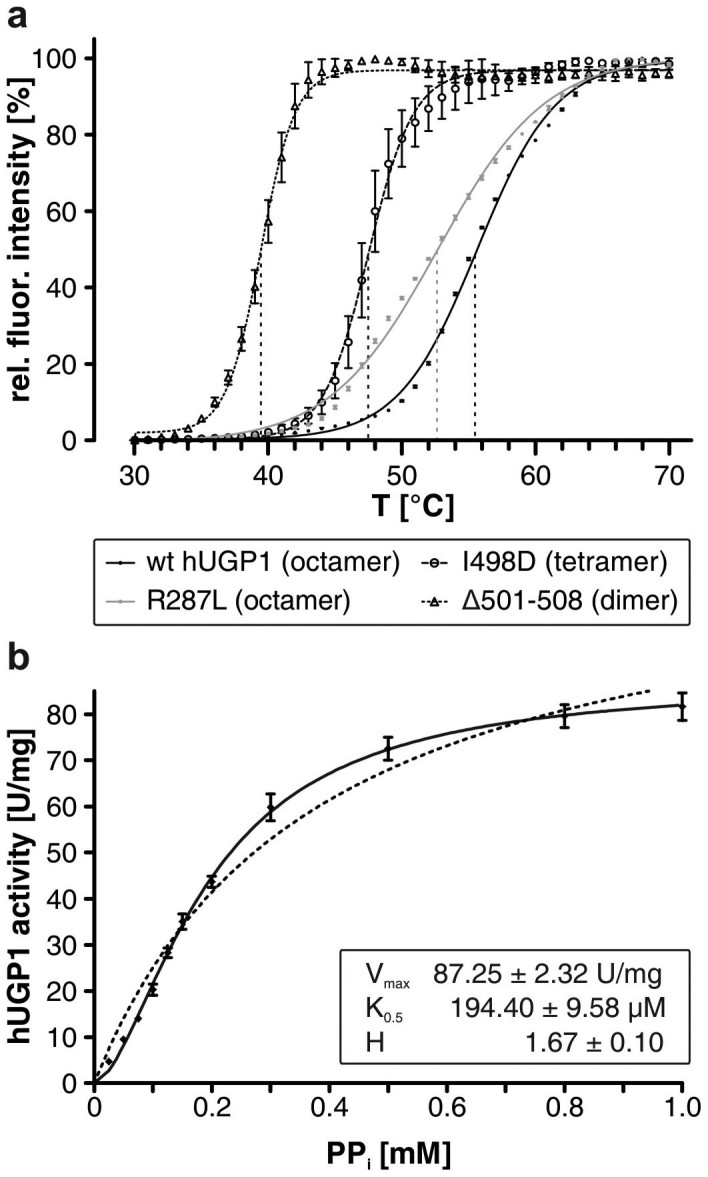
(a) Normalized temperature-dependent fluorescence (depicted as relative fluorescence intensity, y-axis) of the octameric wt hUGP1 and nearly inactive mutants displaying octameric (R287L), tetrameric (I498D*) and dimeric (Δ501-508*) quaternary structures. Inflection points of the curves, representing the melting temperature of the proteins, are indicated by dashed vertical lines. Data points represent means of triplicates ± s.e.m. *Oligomerization status of the corresponding hUGP2 mutants determined in solution24. (b) In vitro activity of wt hUGP1 in the reverse reaction in dependence of PPi concentration. Specific activity (y-axis) is depicted in dependence of substrate concentration (x-axis). Data points represent means of six replicates ± s.e.m. The solid line represents curve fitting to the function y = Vmax · xH/(KH + xH). Kinetic parameters Vmax, K0.5 and H are given as inset. The dashed black line represents curve fit using the Michaelis-Menten-equation y = Vmax · x/(Km + x).