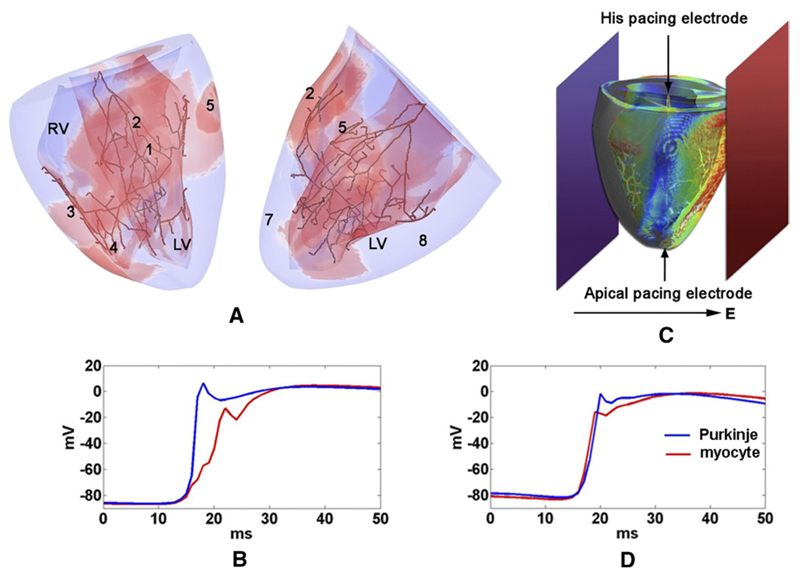
Figure 1.
Ventricular model with PS. A: Sinus activation 45 ms after His stimulation. Epicardial breakthrough sites are enumerated in order of occurrence. Red regions represent Vm >15 mV. B: Planar shocking electrodes are indicated at bath boundaries in dark blue and red. The electric field direction for cross shocks and the single-site pacing locations are indicated by arrows. C, D: Typical junctional propagation delays for anterograde and retrograde propagation, respectively.

