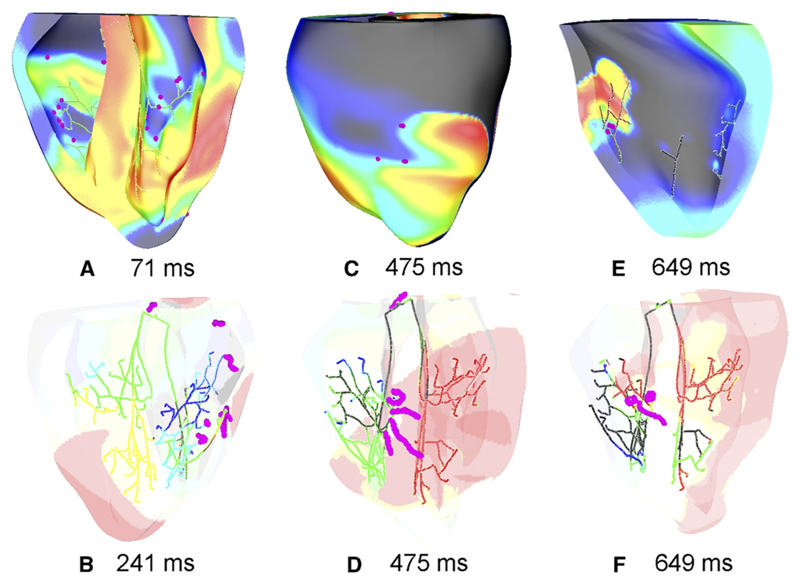
Figure 8.
Phase analysis at various instants during reentry. Phase singularities (pink dots) were concentrated around the distal PS network. Reentrant filaments were consistently anchored to PS endpoints as seen in panels B, D, and F. Upper panels: Vm is indicated by surface color, as in Figure 2. Lower panels: red regions represent Vm >15 mV.

