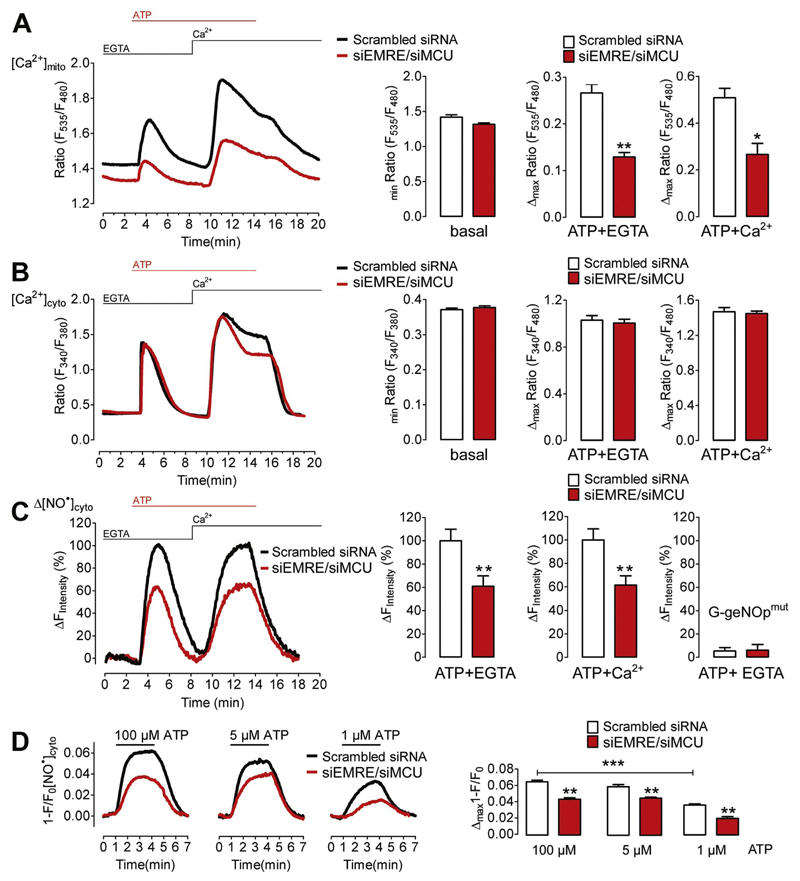
Fig. 2. Knock-down of EMRE and MCU reduces Ca2+-triggered NO• production in EA.hy926 cells.
(A) Average curves of [Ca2+]mito (left panel) in EA.hy926 cells treated with either scrambled siRNA (black curve and white bars, N=3) or siRNAs against EMRE and MCU (siEMRE/siMCU, red curve and red bars, N=3) upon stimulation with 100 μM ATP in the absence of extracellular Ca2+(1 mM EGTA) followed by addition of Ca2+(2 mM). Bar graphs showing average basal Ca2+ level (basal, p=0.0581) and Ca2+ transients in response to 100 μM ATP-stimulated ER Ca2+ release (ATP + EGTA, **p=0.0029) and store-operated Ca2+ entry (ATP + Ca2+, *p=0.0169). (B) Curves representing average of [Ca2+]cyto in control (Scrambled siRNA, black curve, N=6) versus EMRE/MCU ablated (siEMRE/siMCU, red curve, N=7) EA.hy926 cells (left panel) stimulated with 100 μM ATP in the absence (1 mM EGTA) and addition of Ca2+(2 mM) as indicated. Respective statistical analyses of basal levels (basal, p=0.397), maximum cytosolic Ca2+ release (ATP + EGTA, p=0.6373) and maximum cytosolic Ca2+ entry (ATP + Ca2+, p=0.6988). (C) Representative curve of [NO•]cyto in response to ATP stimulation. Statistical analyses of average [NO•]cyto are shown in bar graphs (right panels). Maximal signals (amplitude) of scrambled siRNA- or siMCU/siEMRE-treated cells are defined as 100%. Cells were first stimulated with 100 μM ATP in the absence of extracellular Ca2+ in control cells (Scrambled siRNA, white column, ATP + EGTA, N =17) and cells reduced of EMRE and MCU (siEMRE/siMCU, red column, ATP + EGTA, N =17) and upon Ca2+( 2 mM) addition (right middle column pair). **p=0.0068 (ATP+EGTA) and **p=0.0042 (ATP+Ca2+) vs Scrambled siRNA. Right columns represent maximal fluorescence changes of G-geNOpmut in response to 100 μM ATP in EGTA (1 mM) in control cells (white column, N =11) and cells treated with siRNA against EMRE and MCU (red column, N =10). (D) Average curves of Ca2+-dependent NO formation upon stimulation with 1 μM (upper left panel) 5 μM (upper middle panel) or 100 μM ATP (upper right panel) in the absence of extracellular Ca2+ in EA.hy926 cells treated with either negative control siRNA (Scrambled siRNA, black curves) or siRNA against EMRE and MCU (siEMRE/siMCU, red curves). Statistical analysis of maximum NO• formation in cells stimulated with either 1 μM ATP (lower left panel) representing Scrambled siRNA (white bar, N=3) and siEMRE/siMCU (red bar, N=3); **p=0.0045, with 5 μM ATP (lower middle panel) representing Scrambled siRNA (white bar, N=3) and siEMRE/siMCU (red bar, N=3); **p=0.0087, or with 100 μM ATP (lower right panel) representing Scrambled siRNA (white bar, N=3) and siEMRE/siMCU (red bar, N=3); **p=0.0012.

