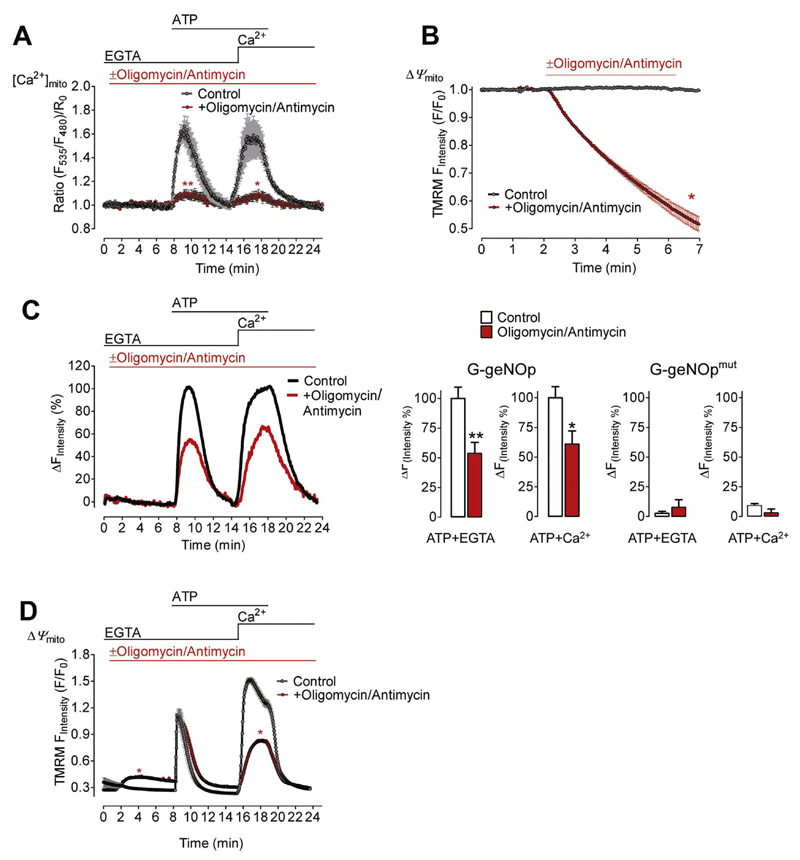
Fig. 4. Cell treatment with oligomycin/antimycin reduces Ca2+-triggered NO• formation.
(A) Average [Ca2+]mito signals ± SEM of EA.hy926 cells expressing 4mtD3cpv under control conditions (black curve N =8) and in the presence of 1 μM oligomycin and 5 μM antimycin (red curve, N =12) in response to 100 μM ATP first in the absence of extracellular Ca2+(1 mM EGTA) and upon addition of Ca2+(2 mM).**p=0.0096 (in EGTA) and *p=0.0159 (in Ca2+) vs. Control. (B) TMRM signals of EA.hy926 cells over time to estimate changes in Ψmito (mitochondrial membrane potential) under control conditions (black curve N =6) and upon addition of 1 μM oligomycin and 5 μM antimycin (red curve, N =6). *p=0.0286. (C) NO• signals of EA.hy926 cells over time expressing G-geNOp in the absence (control, black curve, white bars, N =11) or presence of 1 μM oligomycin and 5 μM antimycin (red curve and bars, N =9). Maximal signals under control conditions in response to 100 μM ATP were defined as 100% (middle right bars). **p=0.0074 (in EGTA) and *p=0.0200 (in Ca2+) vs. Control. Right bars represent maximal fluorescence changes of the NO•-insensitive G-geNOpmut in control cells (white bars N =6) and in the presence of the mitochondria toxins (red bars, N =6). p=0.8016 (in EGTA) and p=0.1508 (in Ca2+). (D) Fura-2 ratio signals of EA.hy926 cells over time under control conditions (black curve, N =6) and in the presence of 1 μM oligomycin and 5 μM antimycin (red curve, N =6). *p=0.0286 (in EGTA) and *p=0.0283 (in Ca2+) vs. Control.

