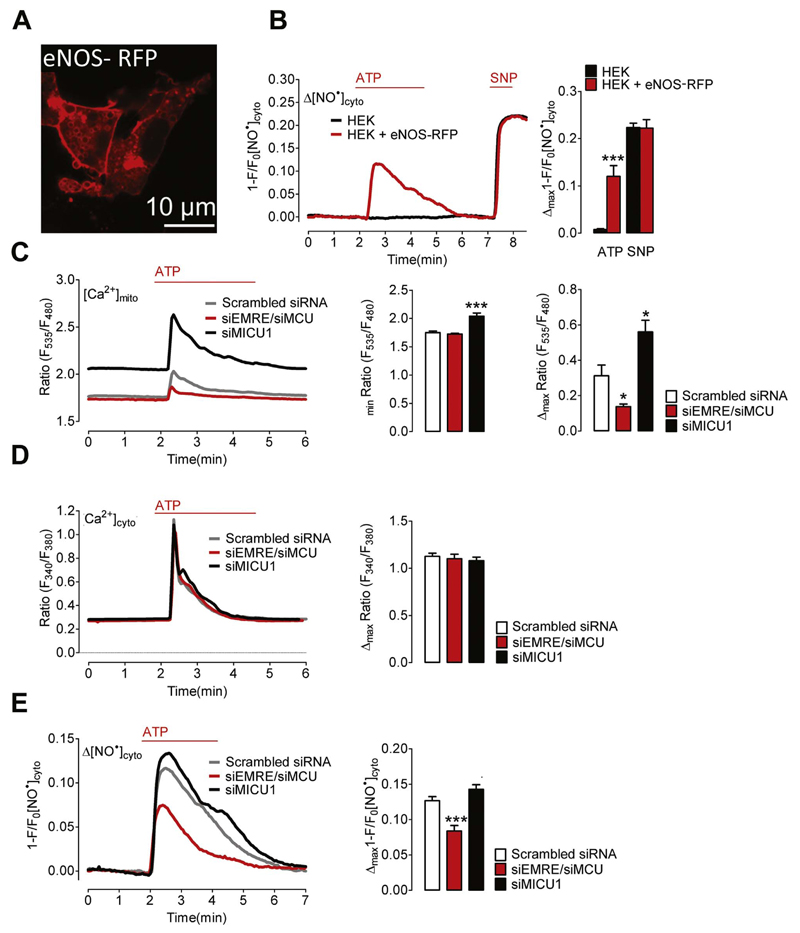
Fig. 7. Mitochondrial Ca2+ uptake controls NO• formation in HEK293 cells expressing eNOS-RFP.
(A) Representative image showing HEK293 cells expressing eNOS-RFP. (B) Representative curves of cytosolic NO• signals ([NO•]cyto) over time in response to 100 μM ATP and 1 mM SNP in control HEK293 cells (black curve and bars, N =5) and HEK293 cells co-expressing eNOS-RFP (red curve and bars, N =3). Left Bars show maximal changes of G-geNOp fluorescence in response to ATP; ***p=0.0005 vs HEK293. Right bars show maximal G-geNOps signals in response to SNP, p=0.9386. (C) Mitochondrial Ca2+ signals in HEK293 cells under control conditions (Scrambled siRNA, grey curve and white columns, N =8), in cells treated with siRNA against EMRE and MCU (siEMRE/siMCU, red curve and red columns, N =8) or against MICU1 (siMICU1, black curve and columns, N =7). Cells were stimulated with 100 μM ATP in EGTA (1 mM). Left columns represent basal 4mtD3cpV ratio values; p=0.4088 (siEMRE/siMCU) vs Scrambled siRNA; ***p=0.0004 (siMICU1) vs Scrambled siRNA. Right columns show mean values of maximal 4mtD3cpV ratio signals; *p=0.0145 (siEMRE/siMCU) vs Scrambled siRNA; *p=0.0152 (siMICU1) vs Scrambled siRNA. (D) Representative cytosolic Ca2+ signals of fura-2/am loaded HEK293 cells treated with scrambled siRNA (Scrambled siRNA, grey curve and white columns, N =3) siRNA against EMRE and MCU (siEMRE/siMCU, red curve and red columns, N =3) or MICU1 (siMICU1, black curve and columns, N =4). Cells were stimulated with 100 μM ATP in EGTA (1 mM). Columns represent mean values of maximal fura-2 ratio signals; p=0.6842 (siEMRE/siMCU) vs Scrambled siRNA; p=0.4253 (siMICU1) vs Scrambled siRNA. (E) Representative cytosolic NO• signals eNOS-RFP expressing HEK293 cells treated with scrambled siRNA (Scrambled siRNA, grey curve and white columns, N =9) siRNA against EMRE and MCU (siEMRE/siMCU, red curve and red columns, N =11) or MICU1 (siMICU1, black curve and columns, N =8). Cells were stimulated with 100 μM ATP in EGTA (1 mM). Columns represent mean values of maximal G-geNOp signals; ***p=0.0005 (siEMRE/siMCU) vs Scrambled siRNA; p=0.0829 (siMICU1) vs Scrambled siRNA.

