
Fig. 2. Effects of siRNA gene perturbations across the human and mouse TLR pathways.
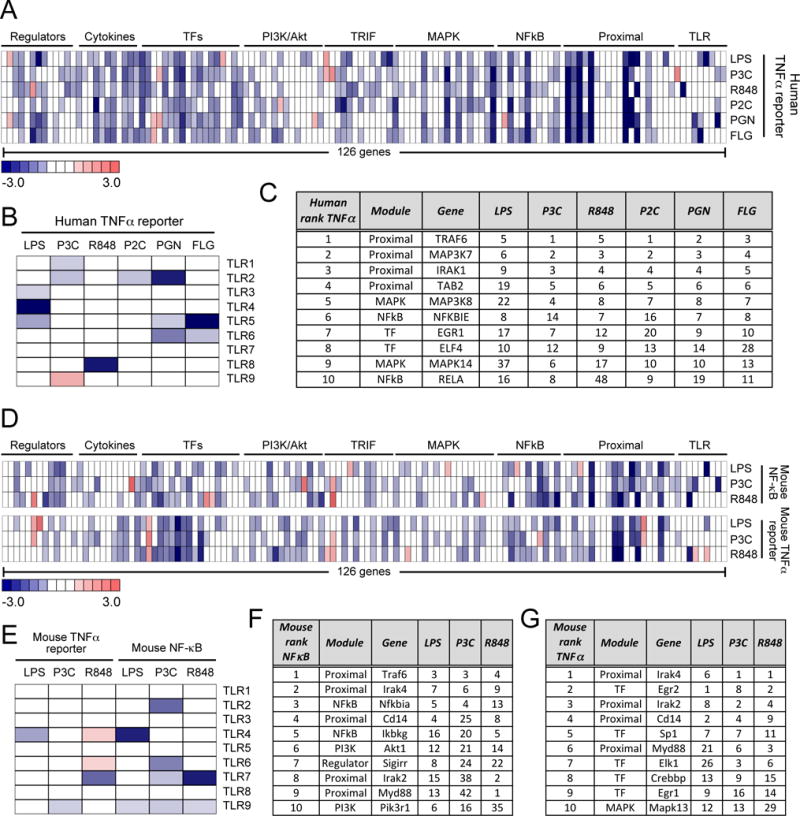
(A to G) Analysis of the effects of gene perturbations on TLR signaling. TLR pathway gene perturbation effects on (A) the TNF promoter–driven transcriptional response of the human THP1 cell line to LPS (10 ng/ml), 100 nM P3C, R848 (10 μg/ml), 1 nM P2C, 1 PGN (10 μg/ml), or FLG (10 ng/ml) and (D) on the NF-κB and Tnf promoter–dependent responses of the mouse RAW264.7 cell line to LPS (10 ng/ml), 100 nM P3C, or R848 (10 μg/ml). (B and E) Effects of the siRNA-mediated knockdown of the indicated TLRs on (B) the TNF promoter-dependent transcriptional response of the human THP1 cell line and (E) the NF-κB– and Tnf promoter–dependent responses of the mouse RAW264.7 cell line to the indicated TLR ligands. The top 10 genes with the most substantial effects on (C) the human TNF promoter–dependent response, (F) the mouse NF-κB response, and (G) the mouse Tnf promoter-driven response across all tested TLR ligands. Rankings for individual TLR ligands are shown, with overall gene order determined by the average rank calculated over all ligands (the full 126-gene ranking scores are shown in table S3). Data in (A), (B), (D), and (E) are presented as median z-scores from six siRNAs per gene. Individual siRNA scores were averaged from three (for A and B) or two (for D and E) independent experiments (see Materials and Methods).