
Fig. 5. Differential characteristics of human and mouse IRAK4 signaling properties.
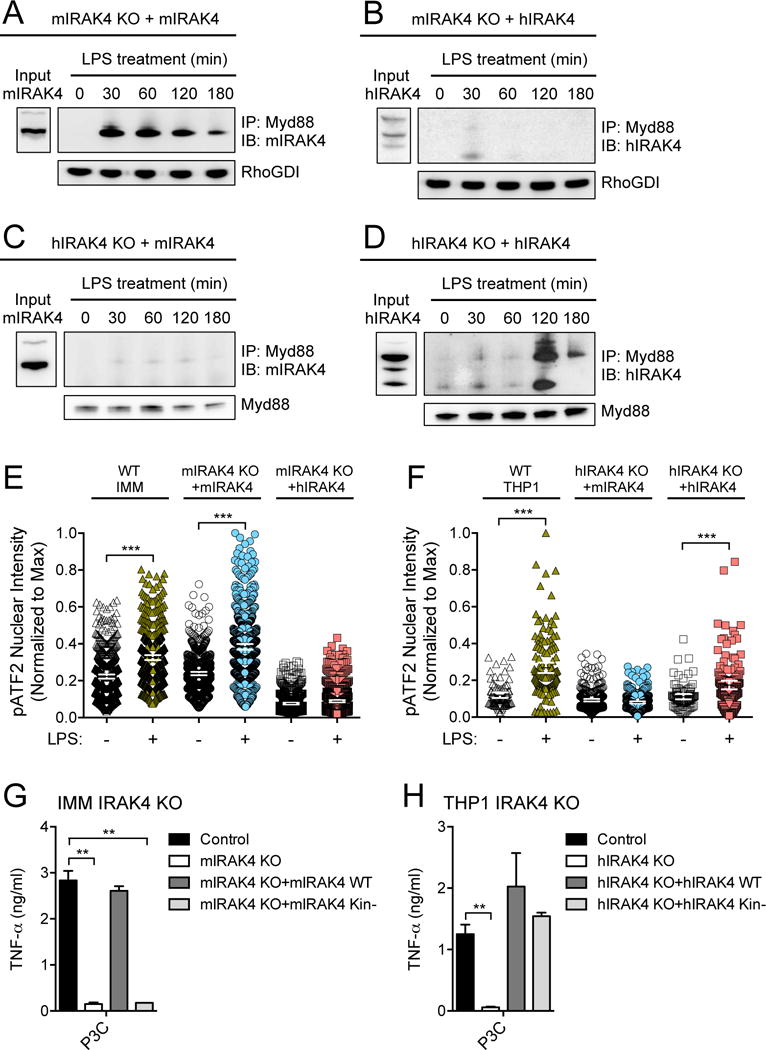
(A and B) Mouse IRAK4 KO IMMs were stably transduced with retrovirus expressing either (A) mouse IRAK4-mCitrine or (B) human IRAK4-mCherry before being treated with LPS (10 ng/ml) for the indicated times. Cell lysates were then subjected to immunoprecipitation (IP) with an antibody against Myd88 and samples were analyzed by Western blotting (IB) with antibody specific for IRAK4. RhoGDI was used as an input control for the Myd88 immunoprecipitation. (C and D) Human IRAK4 KO THP1 cells were stably transduced with retrovirus expressing either (C) mouse IRAK4-mCitrine or (D) human IRAK4-mCherry before being treated with LPS (10 ng/ml) for the indicated times. Cell lysates were then subjected to immunoprecipitation with an antibody specific for Myd88 and analyzed by Western blotting with antibody specific for IRAK4. Myd88 was used as an input control for the immunoprecipitation. (E and F) The nuclear intensity of phosphorylated ATF2 (pATF2) was measured by high-content imaging in either (E) mouse IRAK4 KO IMMs or (F) human IRAK4 KO THP1 cells stably transduced with retrovirus expressing either mouse IRAK4-mCitrine or human IRAK4-mCherry. Cells were left untreated or were stimulated for 20 (IMM) or 60 min (THP1) with 500 nM P3C. Data are shown for the central 98th percentile of cells. (G) IRAK4 KO IMMs were stably transduced with retrovirus expressing either wild-type (WT) or kinase-deficient (Kin−) mouse IRAK4. Cells were stimulated with LPS (10 ng/ml) for 24 hours and the amount of TNF-α secreted was measured by ELISA. (H) IRAK4 KO THP1 cells were stably transduced with retrovirus expressing either WT or kinase-deficient (Kin−) human IRAK4. Cells were stimulated with LPS (10 ng/ml) for 24 hours and the amount of TNF-α secreted by the cells was measured by ELISA. Western blots in (A) to (D) are representative of at least two independent experiments. Single-cell data in (E) and (F) are representative of two independent experiments (100 to 500 cells imaged per condition, error bars indicate mean ± 95% CI). Data in (G) and (H) are means ± SD of two independent experiments. **P < 0.01, ***P < 0.001 by Kolmogorov-Smirnov test (for E and F) or by two-tailed t test (for G and H).