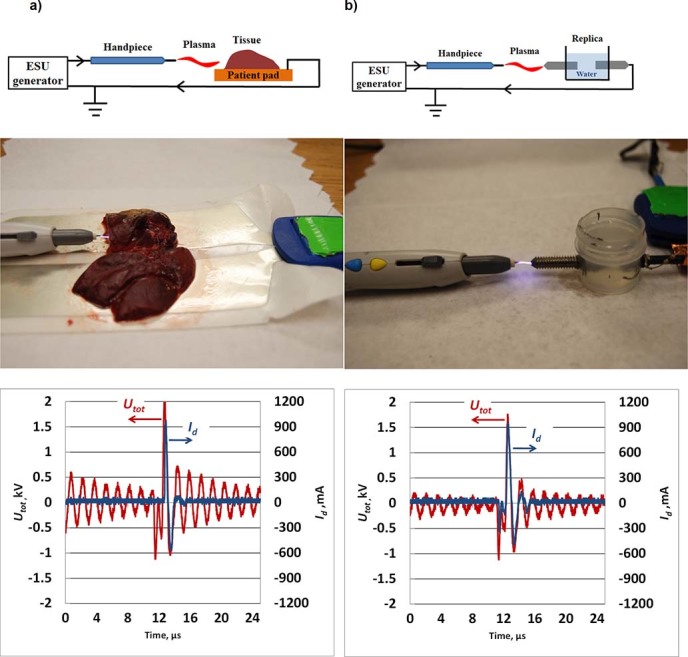
Figure 2. Photograph of the ESU in operation in Argon Plasma Coagulation mode, electrical schematics and current/voltage waveforms of the discharge for ESU power 60 W and flow rate - 3-3.5 LPM: (a) chicken liver sample, (b) inorganic replica.

Similar voltage and current waveforms indicate good agreement of the electrical properties of tissue sample and inorganic replica.
