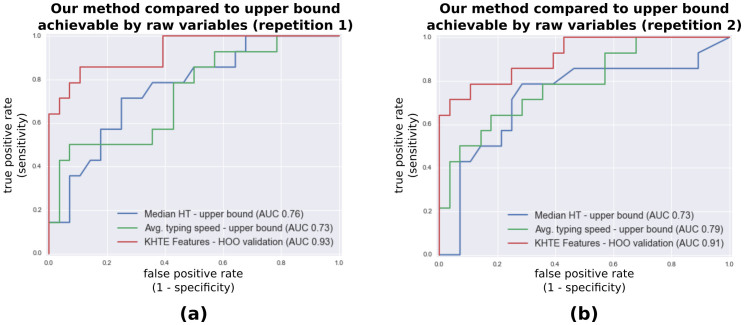
Figure 3. ROC analyses of the classification of the variation between rested and sleep inertia state vs. the variation during similar states.
Our approach employing Key Hold Time Evolution (KHTE) features outperforms the upper bound classification achievable with median hold time (HT) and average typing speed in both repetitions. In the legend, the Area Under the ROC Curve (AUC) scores are shown. The KHTE features are classified by a linear Support Vector Machine tested via a hold-one-out (HOO) approach.

