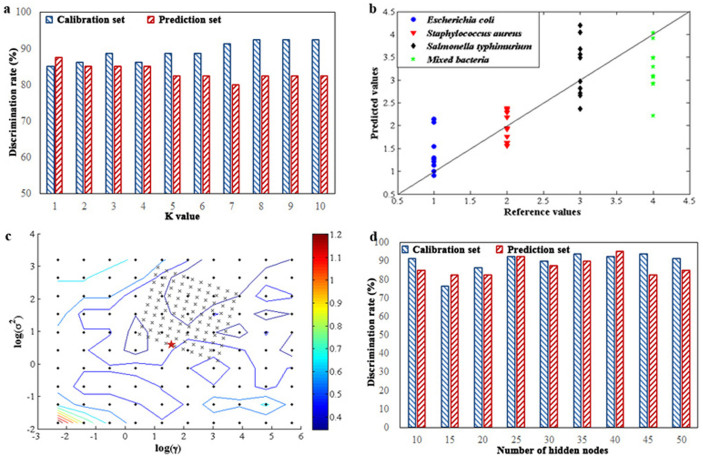
Figure 4.
(a) Discrimination rates of KNN model according to different K values in the calibration and prediction sets; (b) prediction results of samples with different categories using PLSDA model; (c) contour plot of parameters optimization by cross-validation based on the calibration set; (d) OSELM model according to different numbers of hidden nodes in the calibration and prediction sets.

