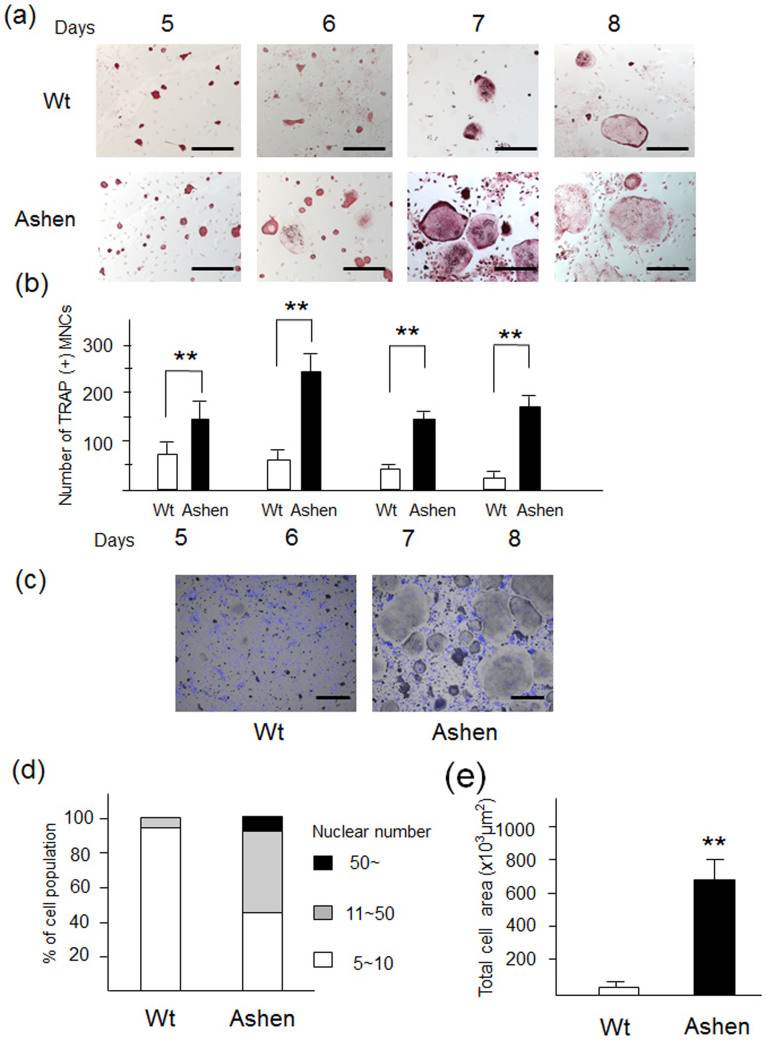
Figure 2. Phenotypes of OCLs derived from control mice (wild-type) and ashen mice.
(a) BMMs derived from wild-type and ashen mice were cultured with M-CSF (10 ng/ml) and RANKL (50 ng/ml) for the indicated days. The cells were fixed and stained for TRAP. Bar: 50 μm. (b) The number of TRAP-positive multinucleated cells was counted at each indicated day. (c) The cells were fixed and stained with nuclear staining DAPI. Bar: 50 μm. (d) the nuclear numbers were counted and classified as 5 ~ 10 (white bar), 11 ~ 50 (gray bar), or more than 50 (black bar). (e) The individual cell area was analyzed by using the BZ analyzer software, dynamic cell count system (Keyence).

