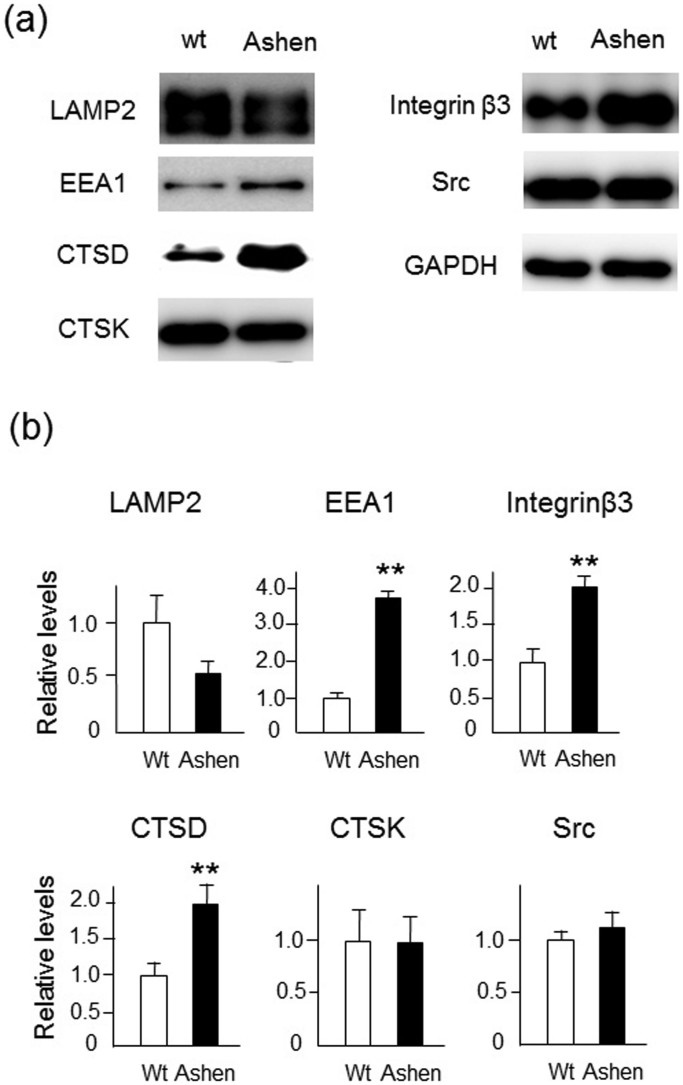
Figure 7. Lysosomal function in OCLs from wild-type and ashen mice.
(a) BMMs were prepared by the method described in “Experimental Procedures”. The OCLs were further differentiated BMMs that were cultured with RANKL (50 ng/ml) and M-CSF (10 ng/ml) for 6 days. The same protein amounts of OCL-lysates were subjected to SDS-PAGE followed by western blotting with antibodies to LAMP2, EEA1, cathepsin D (CTSD), CTSK, integrin β3, Src, and GAPDH. (b) Densitometric analysis for the quantification of each protein in the cell lysate of both cell types. The relative levels were defined as the chemiluminescence intensity per mm2 measured by LAS4000-mini. The data are presented as the mean ± S.D. of values from four independent experiments. **P < 0.01 for the indicated comparison.

