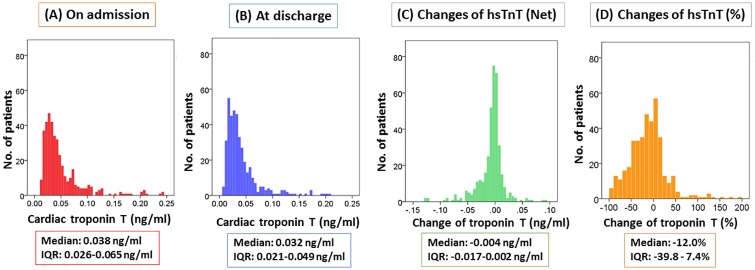
Fig 1. Distribution of hsTnT level on admission to the hospital (A), at discharge (B), changes in hsTnT levels (net) (C) and changes in hsTnT levels (percent) (D).
The median (interquartile ranges) high sensitive cardiac troponin T (hsTnT) levels on admission, at discharge, and changes in hsTnT levels (net) were 0.038 (0.026 to 0.065), 0.032 (0.021 to 0.049), and -0.004 (-0.017 to 0.002) ng/ml, respectively. The percent change of hsTnT was -12.0 (-39.8 to 7.4) %.

