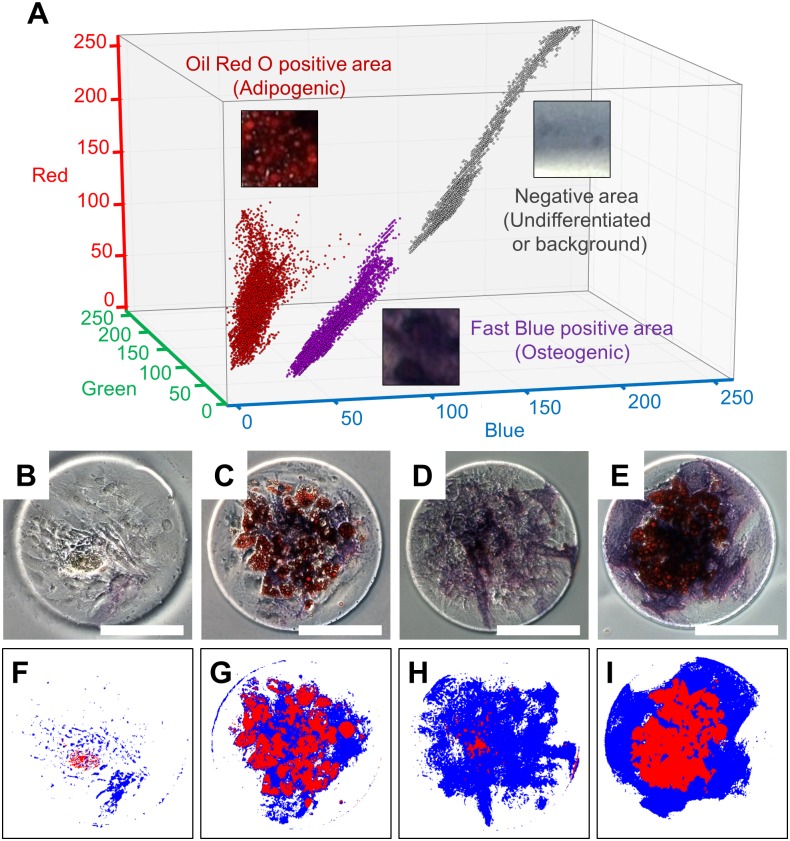
Fig 4. Machine learning based classification of patterned human Mesenchymal Stem Cell (hMSC) differentiation.
Graph (A) shows the color distributions of pixels enclosed in (1) OilRed O positive (Adipogenic), (2) FastBlue positive (Osteogenic), and (3) negative (Undifferentiated or background) areas in a red-green-blue (RGB) three-dimensional color space. Microphotographs (B-E) show the stained surfaces of hMSCs cultured in growth, adipogenesis, osteogenesis, and adipgenesis-osteogenesis mixture media, resulting in classified images (F-I), respectively. White bar indicates 200 μm.

