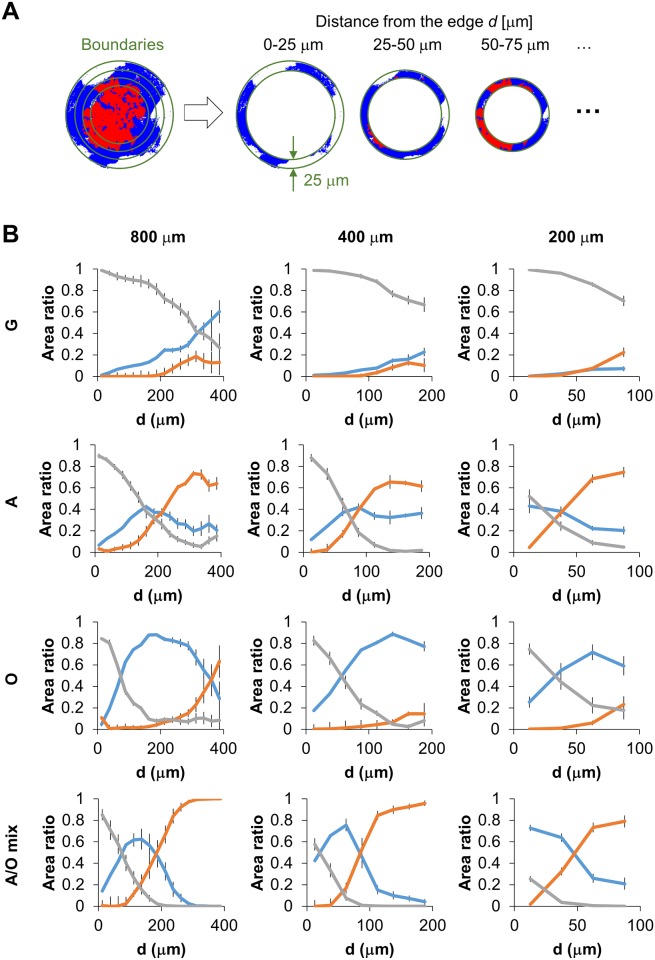
Fig 5. Segmental analysis of fraction of human Mesenchymal Stem Cells (hMSCs) differentiated into different linages.
(A) Post-process to determine the localization of hMSC patterned differentiation. (B) Graphs from the left to right rows show the relationships between the ratio of hMSC differentiation pattern and the distance from the periphery of agarose wall with diameters of 800, 400, and 200 μm, respectively. The lines of graphs from upper to lower indicate hMSC cultivation conditions; growth, adipogenic, osteogenic, and adipogenic-osteogenic mixture media, respectively. The error bar in each graph indicates the standard deviation (Number of analyzed images showing a single confinement: N = 5, 5, and 12 for 800, 400, and 200 μm confinements, respectively).

