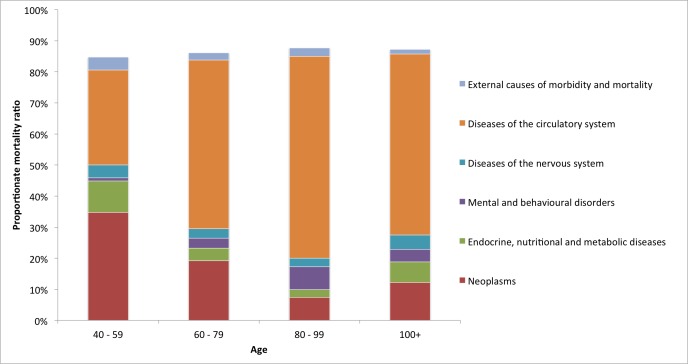
Fig 3. Proportionate mortality ratios for age groups.
Proportionate mortality ratios for underlying causes of death per age group. The number of deaths was 98 for age 40–59, 1352 for age 60–79, 2517 for age 80–99, and 196 for age 100+. The remaining 4 deaths occurred in ages 20–39, PMR is not shown.

