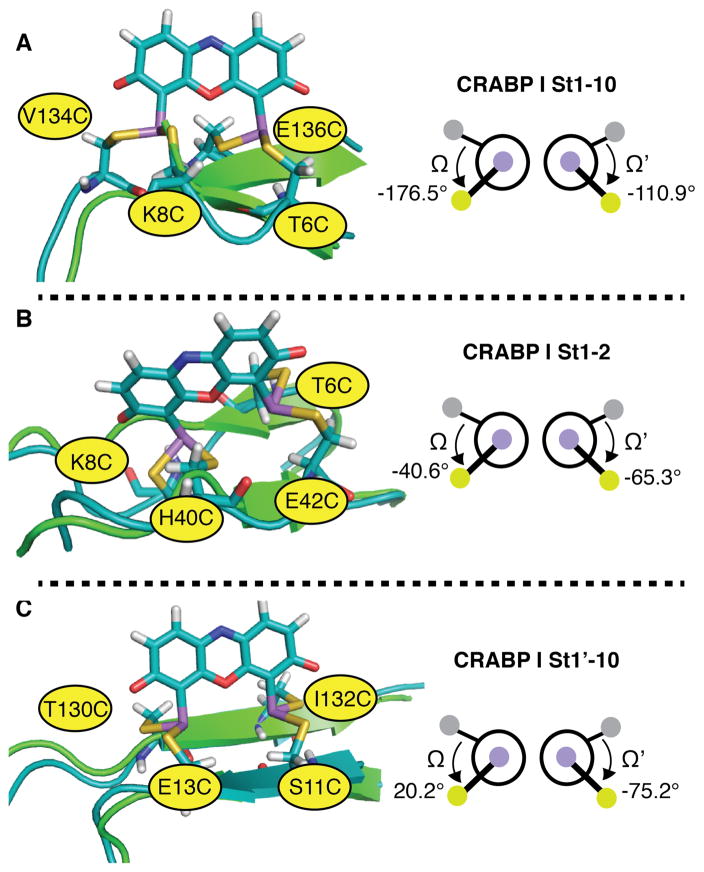
Figure 9.
Models of ReAsH in complex with previously reported bipartite motifs within CRABP I and the associated values of Ω and Ω’: (A) CRABP I St1-10; (B) CRABP I St1-2; and (C) CRABP I St1’-10. The FlAsH complex of variant St1’-10, which was stable to the highest concentration of EDT,16 possessed a Cys4 arrangement closest to the ideal, with Ω and Ω’ values of 20.17 and -75.17. In each case, the minimized structure of the indicated protein variant bound to ReAsH is shown in teal and aligned with the native structure shown in green.

