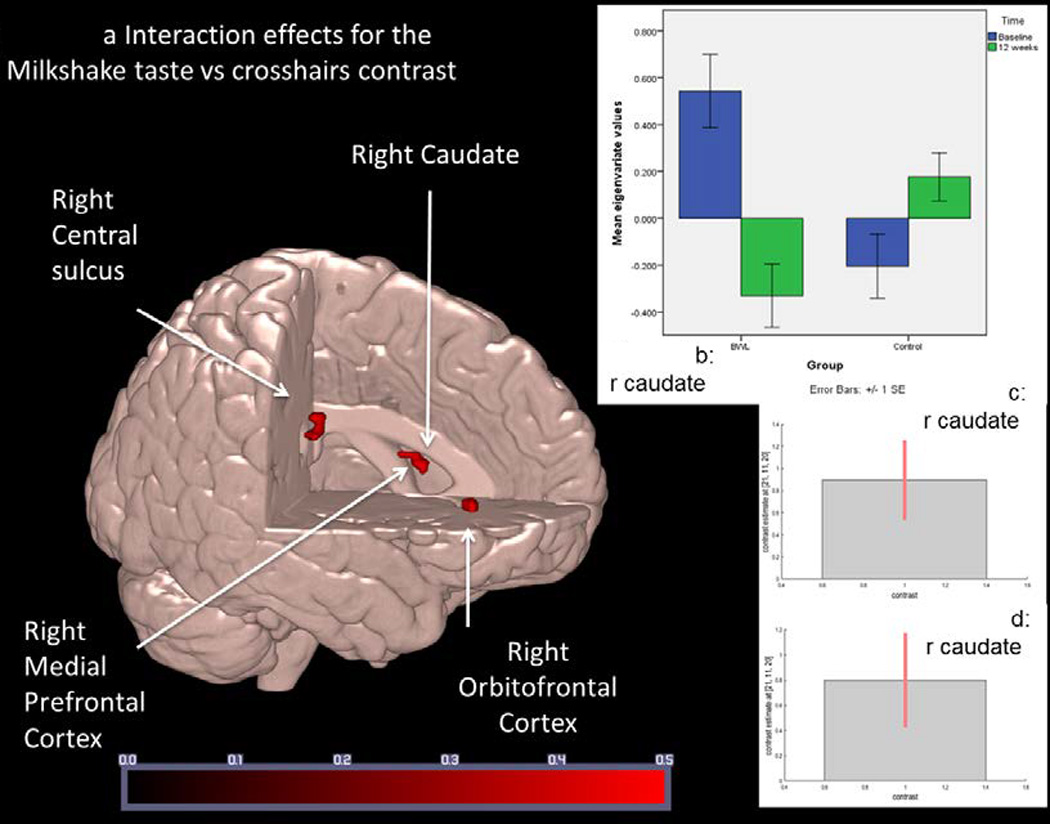
Figure 1.

Regions associated with differential fMRI BOLD response to milkshake taste in Behavior Weight Loss (BWL) compared to control from baseline to 12-weeks post-baseline (N = 34).
a: Regions associated with differential change between the BWL and Control groups over time where p < .01 FWE-corrected. Colored bar represents Z score values. Areas are as described in Table 5.
b: Right caudate response comparing BWL and control groups at baseline and 12 weeks. Eigenvariate values show greater activation at baseline in BWL at baseline compared to control and greater activation in BWL at baseline compared to BWL at 12 weeks. Error bars represent +/− 1 standard error.
c and d: Cohen’s d and 90th percentile CI of the size of the effect of right caudate activation in BWL at baseline compared to control (Figure 1c) and between baseline BWL and 12 weeks BWL (Figure 1d).
