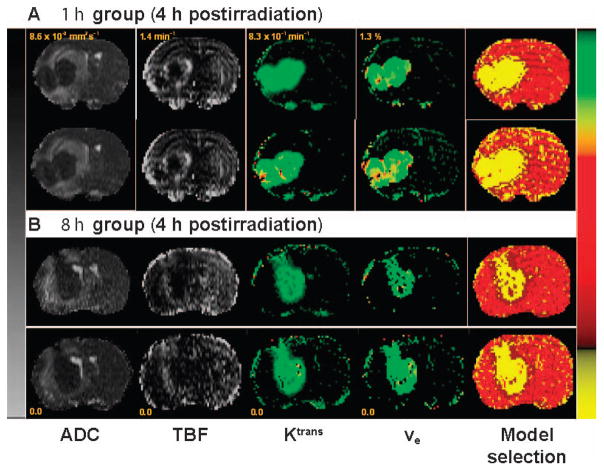
FIG. 3.
Representative sets of pre- and post-treatment parametric maps from the 1 (panel A) and 8 h (panel B) groups at 4 h postirradiation. Maps from left to right: ADC, TBF, Ktrans, ve and model selection; pretreatment is shown in the top row and post-treatment in the bottom row. The left scale bar is shared between ADC and TBF maps for both sets, but has different scaling as indicated in the range for each. The right color scale bar is given in common to Ktrans, ve and model selection maps, but also with different scaling for each parameter. For the model selection map, yellow is model 3 acceptance, dark red is model 2 acceptance and red is model 1 acceptance. Note the improvement in TBF in the post-treatment map for the 8 h group and the lack of change between pre- and post-treatment in Ktrans maps, which indicate vascular normalization and evidence of treatment effect at this time point.

