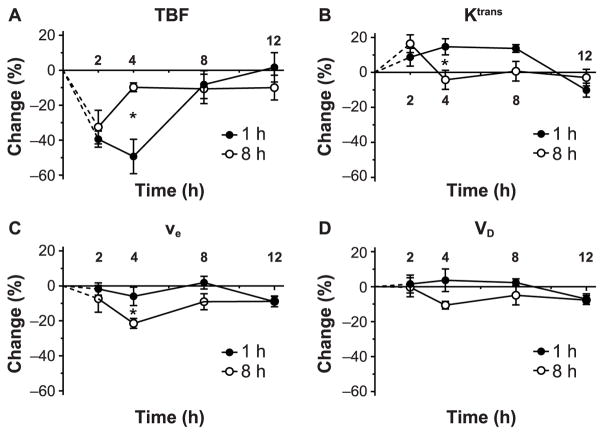
FIG. 5.
Comparison of percentage changes between the 1 and 8 h groups for each parameter. Panels A–D: TBF, Ktrans, VD and ve, respectively. Notably, there is great divergence in the vascular parameter values at the 4 h time point between the 1 and 8 h groups where the significant changes occur. TBF, Ktrans and VD values for the 1 and 8 h groups were significantly different at 4 h postirradiation (P = 0.010, 0.030 and 0.032, respectively), while ve was not significantly different (P = 0.071). In contrast, ADC did not show any difference or particular pattern between 1 and 8 h groups (data not shown).

