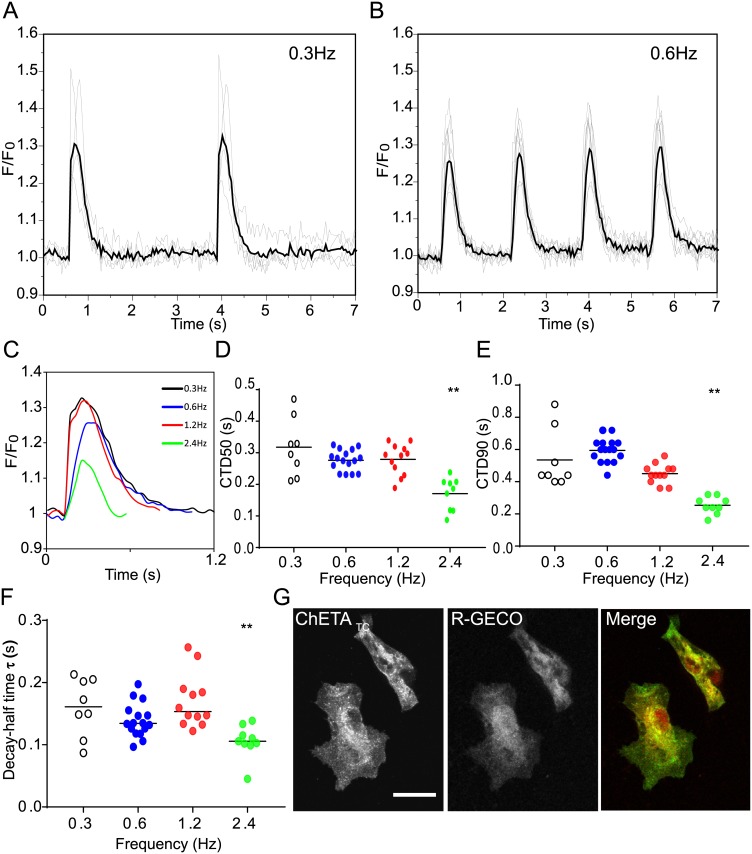
Fig 2. Expression and function of ChETATC /R-GECO in single stem-cell derived cardiomyocytes.
hSC-CM’s were singularised and replated at low density before stimulation at 0.3Hz, 0.6Hz, 1.2Hz, or 2.4Hz with 405nm light, and simultaneous calcium transient visualisation. (A&B) Averaged response is shown by the heavy line, individual cell response by the thin line for 0.3Hz, and 0.6Hz stimulation. (C) Pacing up to 2.4Hz was possible, average results of single calcium transients are shown. (D-F) From the transient it is possible to measure the half maximal width (CTD50), and the 90% transient duration (CTD90), slopes of activation and decay can also be estimated. Individual cell responses are plotted with sample means represented by black bars. (G) Expression analysis of ChETATC and R-GECO in hSC-CMs does not show the same striated pattern seen in primary cells as these cells lack T-tubule invaginations. Significance values are indicated by * (P = <0.05), and ** (P<0.005) respectively. Scale bar = 10μm.

