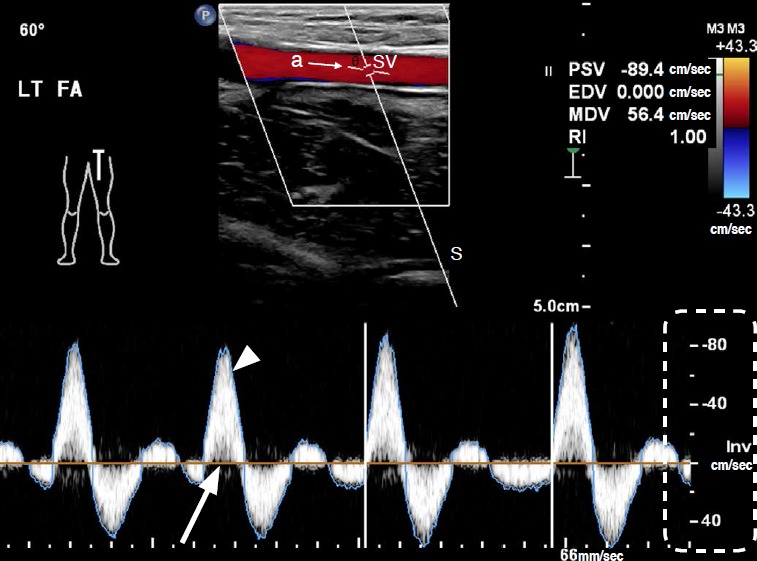
Fig. 5. Color and pulsed-wave Doppler sonograms of normal lower extremity arteries with parameters.

Top: In a color image of a pulsed-wave Doppler sonogram, the color box is tilted to be parallel to the arterial axis using the “steer” key. Doppler angle (θ) is 60° in this case and is formed by the Doppler line of sight (S) and the axis of arterial flow (a). SV, sample volume; LT FA, left femoral artery; PSV, peak systolic velocity; EDV, end-diastolic velocity; MDV, minimum diastolic velocity; RI, resistivity index. RI=(PSV-EDV)/PSV. Bottom: On the Doppler spectrum, time (seconds) is represented on the x-axis. Blood flow velocity (cm/sec) is shown on the y-axis (dashed line). Flow direction relative to the transducer is shown in relation to the spectrum baseline (arrow). The “high-Q” is the blue outline of the Doppler spectrum (arrowhead).
