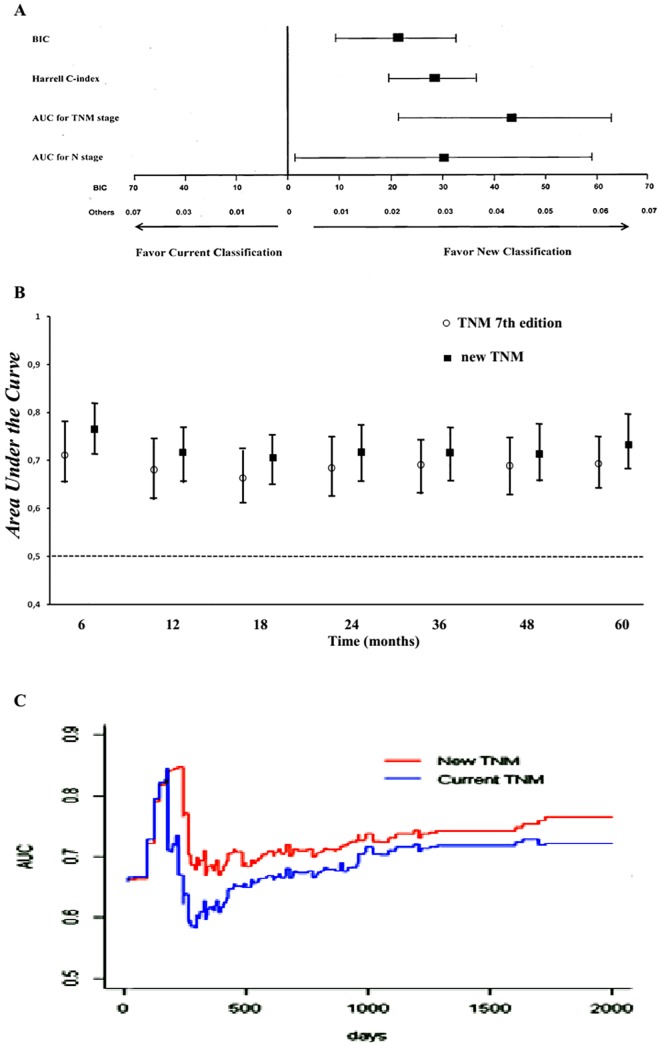
Fig 3. Accuracy of the competing staging systems to predict disease-free survival rate.
(A) Results from bootstrap analysis (1,000 samples). The mean differences in BIC and Harrell C-index with 95% confidence intervals were based on multivariable logistic regression including variables grouped in the best model selected by Cox's analysis. The mean differences in the Area Under the Curve (AUC) for TNM stage and AUC for N stage with 95% confidence intervals were calculated by using the time-dependent receiver-operating-characteristic (ROC) analysis for censored survival data. By these procedures, 95% CIs were computed for differences in the four indices indicating significantly different predictive ability of two staging systems if the zero value was not included. (B) Areas under the ROC curves computed by the time-dependent analysis for censored survival data based on different staging systems according to TNM 7th edition and the new TNM model. Mean AUC values and their 95% CIs were calculated at several time points of follow-up and for each competing system. Error bars represent 95% bootstrap confidence intervals. (C) Analysis of the predictive accuracy of the two competing staging systems through the 5th year of follow-up, computed by the time-dependent ROC analysis for censored survival data.

