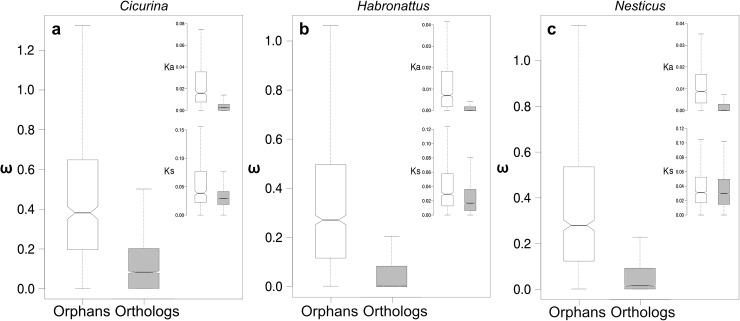
Fig 6. Boxplots of evolutionary rate comparisons between orthologs (grey) and orphan genes (white).
(a) Cicurina, (b) Habronattus and (c) Nesticus. The main plot shows estimates of ω, while the inset shows Ka (top) and Ks (bottom). Outliers have been removed to better visualize the inter-quartile ranges. Mann-Whitney U tests indicate that all parameter estimates are significantly greater in orphan genes, with the exception of the Nesticus Ks comparison which shows no significant difference.

