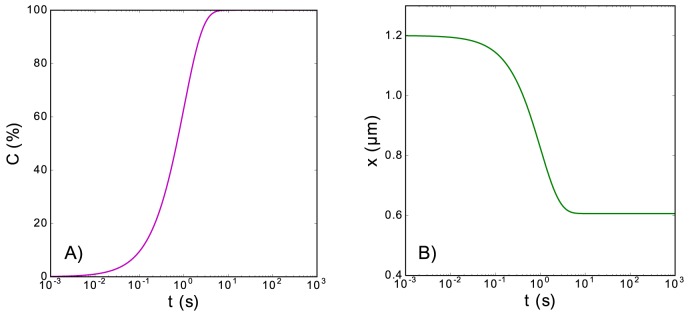
Fig 5. Ligand binding evolution for a unique binding mode.
(Panel A): Time evolution of the coverage of the polymer when there is a unique binding mode. (Panel B): Temporal evolution of the extension corresponding to the evolution of the coverage shown in Panel (A). Both panels correspond to the following set of parameters: kb = 1 s−1, kr = 10−5 s−1, N = 5080, m = 35, d0 = 0.57 nm, Lp = 0.715 nm, K0 = 700 pN, a = 5 nm, KBT = 4.11 pN nm, and F = 5 pN. For the extension contribution of the naked monomers, we have employed the Marko-Siggia implicit formula [Eq (2)].

