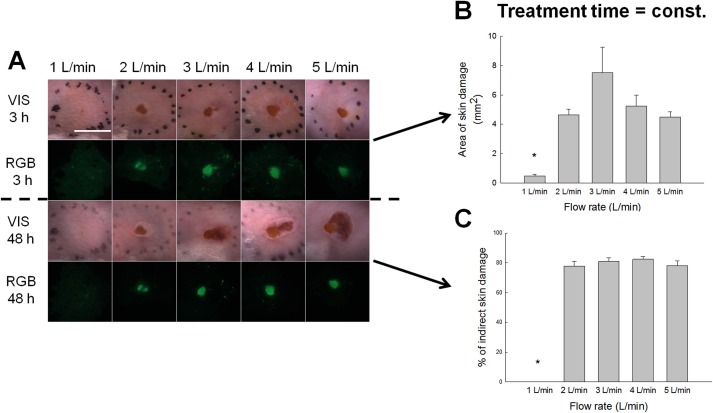
Fig 3. Skin damage observed under different plasma flow rates.
A) Representative images of the skin damage in the treated region. Treated skin regions were observed under stereomicroscope. Images were taken under visible light (VIS) and the fluorescence was observed under RGB (red, green, blue) parameters. Scale bar: 5 mm. B) The area of the direct skin damage was evaluated from RGB images. Error bars indicate SEM. *P value < 0.05 between the selected group and the group treated under the highest plasma flow rate (treated 4 min under 5 L/min). C) Percentage of indirect skin damage calculated from the total damage (direct and indirect) measured 48 h post-treatment. Damage was statistically evaluated from RGB image. Error bars indicate SEM.

