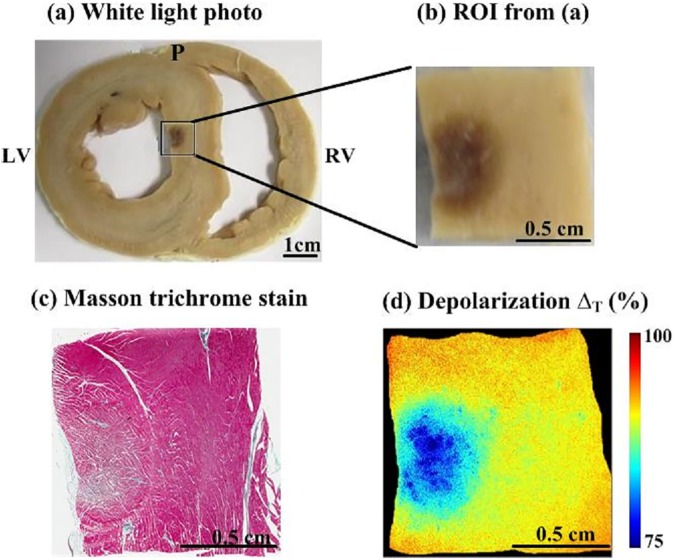
Fig 2. Polarimetry reveals regions of radiofrequency ablation.
(a) White light photograph of gross myocardial tissue sample from the septum with RFA lesion, (b) Magnified view of the ROI analyzed with optical polarimetry, the RF ablated region appears dark, (c) Masson’s trichrome histology of the same sample, and (d) Depolarization map of the region analyzed with optical polarimetry. The RFA region had lower depolarization. RV = right ventricle; LV = left ventricle; P = posterior.

