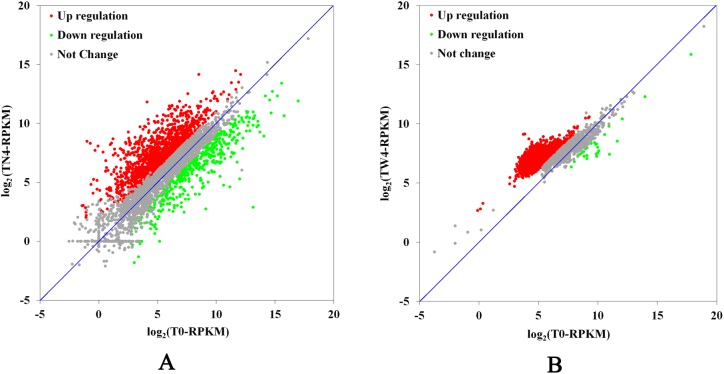
Fig 2. Scatterplot of the gene expression levels of the resistant and parental strains.
The vertical coordinates represent the log2-transformed RPKM values for each gene in the resistant strain, and the horizontal coordinates represent the log2-transformed RPKM values for each gene in the parental strain. Green, upregulated genes; red, downregulated genes; gray, unchanged gene. A: resistant strain TN4 and parental strain T0; B: resistant strain TW4 and parental strain T0.

