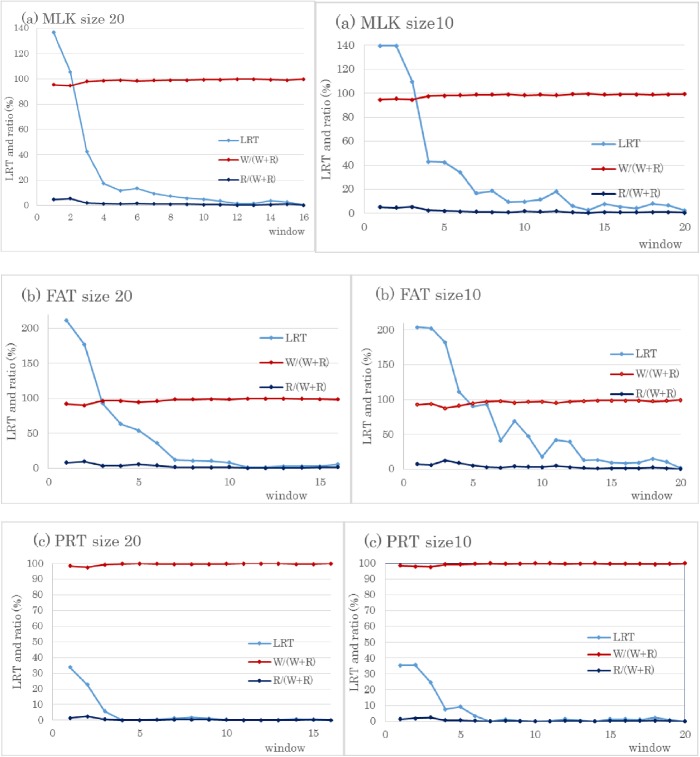
Fig 2. LRT and percentages of regional (R) and whole genomic variances (W) in total genomic variances (W+R) using 20 or 10 SNPs for BTA14.
The vertical axis indicates the likelihood ratio test (LRT) and ratio (%), and the horizontal axis is the window number at the end of BTA14. (a) milk (MLK), (b) fat (FAT), and (c) protein yield (PRT); size 20 and size 10 are window sizes using 20 SNPs and 10 SNPs, respectively.

