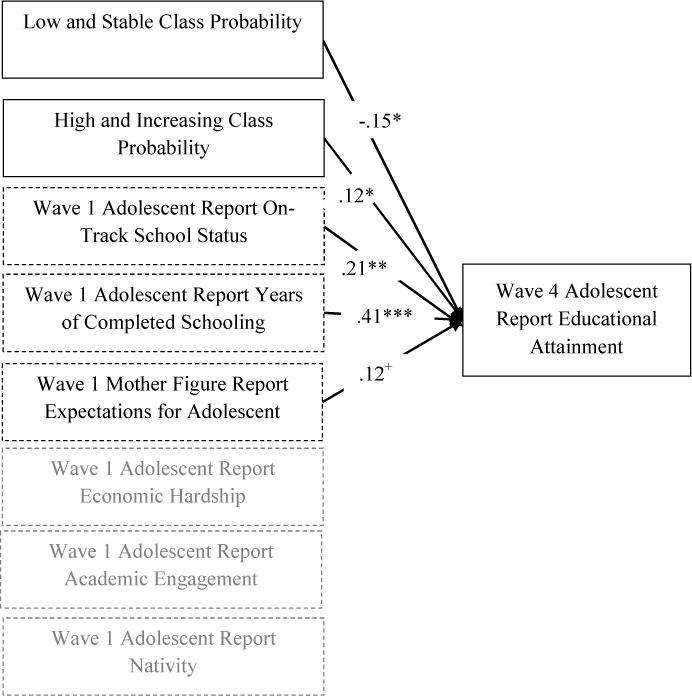
Figure 3.

N = 191. Educational expectation trajectory probabilities as predictors of adolescents’ educational attainment.
Note. Nativity: 0 = Mexico-born, 1 = U.S.-born. On-track: 0 = not on track, 1 = on track. Standardized coefficients are presented. Only significant paths are shown. Covariates are represented by dashed lines. All non-significant predictors are indicated by grey font. The moderate and increasing class was used as the reference group. Model fit: χ2 (df = 7) = 11.77, p = 0.11; CFI = 0.95; RMSEA = 0.06 (90% C.I. = 0.00, 0.12); SRMR = .05. *** p < .001. ** p < .01. * p < .05.
