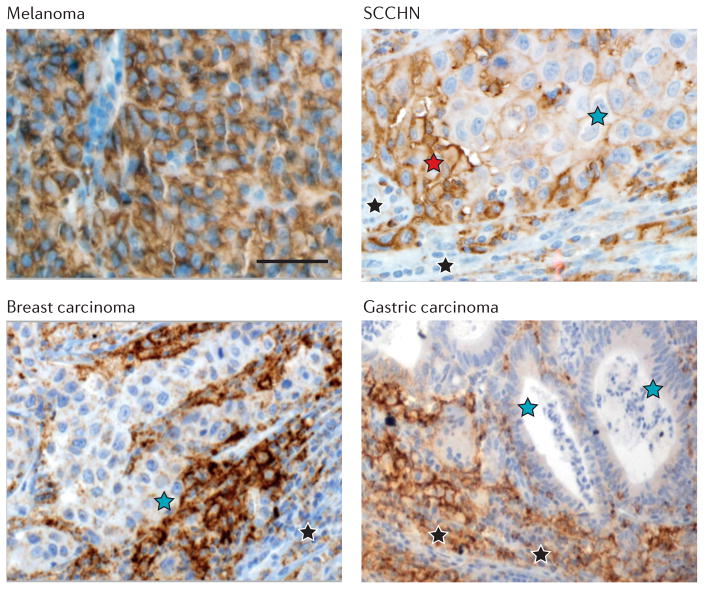
Figure 3. PDL1 expression patterns in different types of cancer.
In all panels, brown staining indicates programmed cell death 1 ligand 1 (PDL1) protein expression, detected with immunohistochemistry. Upper left panel: a melanoma specimen shows broad PDL1 expression on all malignant cells, independent of an immune infiltrate. This pattern, seen in approximately 1% of melanocytic lesions, suggests oncogene-driven constitutive PDL1 expression. Upper right panel: a squamous cell carcinoma of the head and neck (SCCHN) shows broad areas of low-level PDL1 expression on tumour cells (blue star), with heightened expression at the boundary of tumour nests (red star) with immune infiltrates (black stars); these features suggest a combination of oncogene-driven PDL1 expression and adaptive immune resistance. Lower left panel: a breast carcinoma shows PDL1 expression on malignant cells (blue star) confined to areas immediately adjacent to immune cells (T cells and associated macrophages, black star), many of which also express PDL1. This pattern is seen in approximately 20% of breast cancers. Lower right panel: a gastric carcinoma shows PDL1 expression on infiltrating immune cells (black stars) immediately adjacent to tumour cells, but not on the surface of tumour cells themselves (blue stars). A similar pattern of PDL1 expression has also been described in colorectal cancers. Distinct patterns of PDL1 expression may be observed not only in different tumour types, but also in individual cases within the same tumour type. Scale bar, approximately 50 μm.

