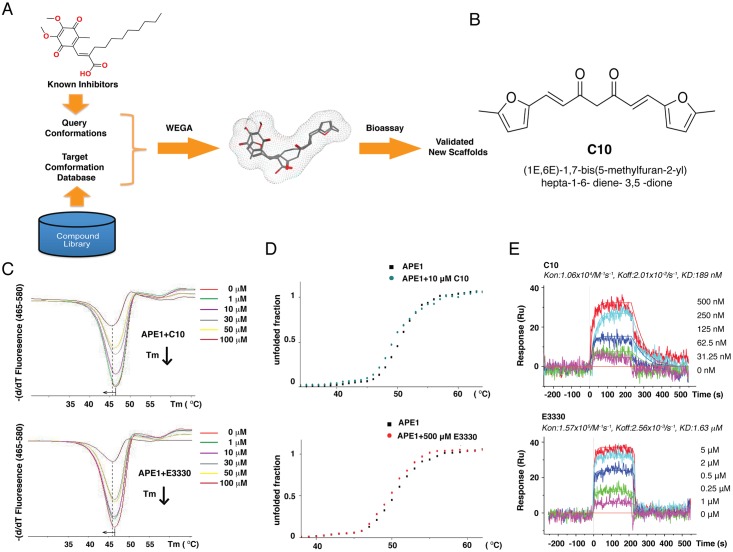
Fig 3. A ligand-base virtual screen led to identification of C10 as a potential APE1 inhibitor.
(A) Schematic diagram of ligand-based virtual screen using a 3D molecular superimposing algorithm (WEGA) against a small molecular tangible library. (B) Structure of C10. (C) Differential scanning fluorimetry (DSF) assays were performed with various concentrations of either C10 and E3330 and the melting curves of APE1 were shifted to the left by 1.3°C and 1.0°C, respectively. (D) The effect of C10 and E3330 on APE1 melting curve as measured by circular dichroism (CD). The Melting curves of APE1 were shifted to the left with both C10 and E3330. (E) Surface plasmon resonance (SPR) was used to determine the binding constants of interaction C10 and E3330 with APE1 and the KD values were shown.

