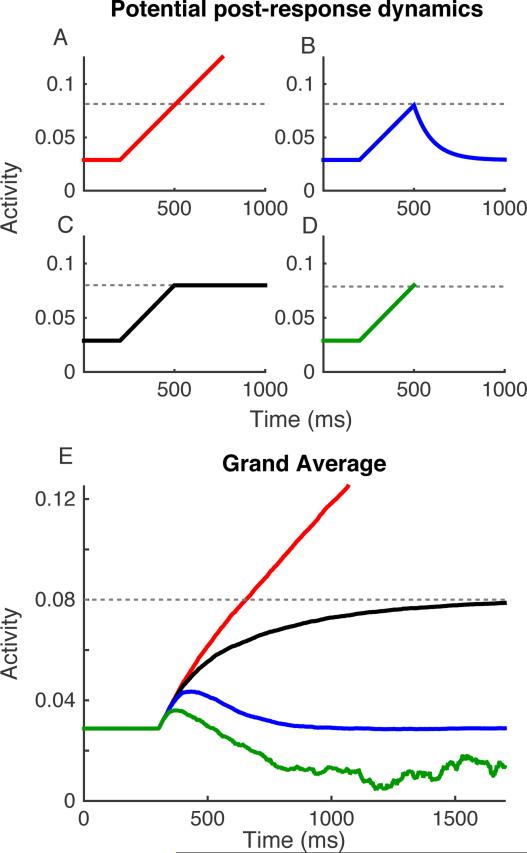
Figure 7.
Different assumptions about post-response activity can strongly influence average model dynamics. (A-C) Four illustrations of potential post-response dynamics on single trials. (A, red) Evidence accumulation continues after the threshold is reached, (B, blue) evidence decays back to starting point, (C, black) evidence remains at the threshold levels, and (D, green) evidence is clipped when the threshold is reached. (E) Average dynamics over 5000 simulated trials for the same set of model parameters, but assuming different forms of post-response dynamics. Parameter values are identical to those used for Figure 2. Colors indicate post-response dynamics illustrated in A-D. The green line in which activity on individual trials is clipped at RT becomes noisier as time progresses because fewer trials contribute to the average.

