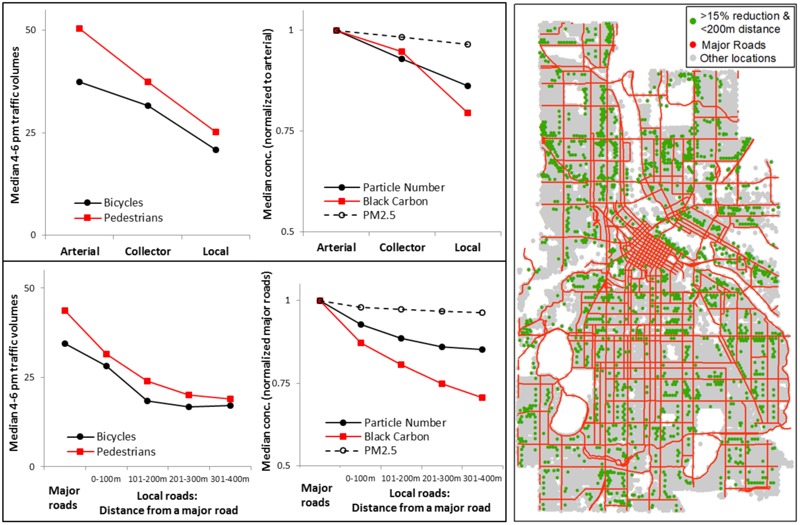
Figure 3.

Median bicycle and pedestrian traffic volumes and particulate concentrations (conc.) by street functional class (upper-left panel) and distance from a major road (bottom-left panel). Right panel: Locations that are within 200 m of a major road (75th percentile distance for city blocks in Minneapolis) and, relative to that road, had at least a 15% reduction in PN or BC concentration. Underlying street and land use data are from Minnesota Geospatial Commons (https://gisdata.mn.gov/).
