

Abstract
Stuttering is a neurodevelopmental disorder that affects the timing and rhythmic flow of speech production. When speech is synchronized with an external rhythmic pacing signal (e.g., a metronome), even severe stuttering can be markedly alleviated, suggesting that people who stutter may have difficulty generating an internal rhythm to pace their speech. To investigate this possibility, children who stutter and typically-developing children (n = 17 per group, aged 6–11 years) were compared in terms of their auditory rhythm discrimination abilities of simple and complex rhythms. Children who stutter showed worse rhythm discrimination than typically-developing children. These findings provide the first evidence of impaired rhythm perception in children who stutter, supporting the conclusion that developmental stuttering may be associated with a deficit in rhythm processing.
Keywords: developmental stuttering, beat perception, rhythm, timing, temporal processing
1. Introduction
Stuttering is a speech disorder characterized by frequent occurrences of repetitions or prolongations of sounds, syllables, or words that disrupt the rhythmic flow of speech (World-Health-Organization, 2010). Stuttering onset is typically observed between the ages of two and five years when children begin to form simple sentences. Of these children who stutter, up to 80% will recover from stuttering (Andrews et al., 1983; Yairi & Ambrose, 1999). Despite decades of behavioral and imaging research, the exact mechanisms behind speech disruptions in people who stutter remain unclear (e.g., Alm, 2004; Packman, Code, & Onslow, 2007).
One of the hallmarks of skilled motor behavior such as fluent speech production is accurate timing (Zelaznik, Smith, & Franz, 1994). Many models of speech timing have proposed that speech, like other motor activities, is rhythmically structured in time (e.g., Allen, 1973; Cummins, 2009; Cummins & Port, 1998; Dilley, Wallace, & Heffner, 2012; Martin, 1972; Tilsen, 2009). Rhythm can generally be defined as a serial pattern of durations marked by a series of events, and perceptually as the perceived temporal organization of the physical sound pattern (McAuley, 2010). Wendahl and Cole (1961) modified recordings of adults who do and do not stutter to remove disfluencies and then asked participants to evaluate the speech on measures such as rate (i.e., normal tempo) and rhythm. Their results demonstrated that even during fluent productions, adults who stutter had a less typical rate of speech and used less rhythmical speech patterns than adults who do not stutter. DiSimoni (1974) likewise found differences in the timing of productions of speech segments in adults who stutter compared with controls. Kent (1984) suggested that the primary difference between people who stutter and fluent speakers can be found in the capacity to generate temporal structures of action. He suggested that a reduced ability to generate temporal patterns for speech perception and production is a central disturbance in stuttering behavior. Andrews and colleagues (1983) also suggested that an unreliable mechanism for timing control may exist in adults who stutter.
One well-known phenomenon is that people who stutter become more fluent when synchronizing their speech to an external pacing signal, such as an isochronous metronome (Wingate, 2002; Wohl, 1968). Other conditions such as speaking in unison with another person (“choral speech”) (Adams & Ramig, 1980; Ingham & Carroll, 1977), and singing (Glover, Kalinowski, Rastatter, & Stuart, 1996) also have similar fluency inducing effects. These conditions may reduce disfluency in people who stutter because they each provide an external rhythmic timing reference during speech production, something that may not be present during spontaneous speech production. Etchell, Johnson, and Sowman (2014) proposed a theory in which the “core” neurophysiological deficit in stuttering is based on a dysfunction within a brain network that supports internal timing, resulting in reliance of a secondary system that utilizes external timing cues to sequence speech movements.
Recent research supports the role of the basal ganglia thalamocortical (BGTC) network in rhythm processing and internal generation of a periodic timing signal (i.e., a beat) (Grahn, 2009; Grahn & Brett, 2007; Grahn & McAuley, 2009), as well as temporal prediction (Schwartze & Kotz, 2013). The BGTC network includes the basal ganglia (putamen), the supplementary motor area (SMA), and pre-motor and auditory regions. Recent findings from functional and structural magnetic resonance imaging (MRI) studies have shown that people who stutter may have deficient connectivity among brain areas that support auditory-motor integration, timing and rhythm processing (Chang, Horwitz, Ostuni, Reynolds, & Ludlow, 2011; Lu et al., 2010). Moreover, a recent study reported that children who stutter have attenuated functional and structural connectivity in the BGTC network compared to age-matched controls (Chang & Zhu, 2013). One study examined brain activity during induced fluency conditions (i.e., reading in synchrony with a metronome beat and reading in chorus), compared to reading in solo in adults who stutter (Toyomura, Fujii, & Kuriki, 2011). The results showed that under solo reading conditions (where speakers who stutter were markedly disfluent compared to the induced fluency conditions), the basal ganglia (putamen), inferior frontal gyrus, and the other motor cortical regions within the BGTC network had significantly decreased brain activity compared to controls. During the metronome-timed speech condition, motor areas within the BGTC network heightened activity in the stuttering group and thus the significant group differences observed during solo speech disappeared; in addition, in the stuttering group there were bilateral increases in temporal cortex activity during both of the fluency inducing conditions (i.e., metronome-timed and choral speech). In sum, a growing body of work suggests a possible deficit in the BGTC network in people who stutter, and potential deficits in internal generation of rhythm that normally guides the timing of fluent speech. Related to this, it has been posited that impairment in basal ganglia function to produce timing cues may be a major deficit underlying stuttering (Alm, 2004).
We are not aware of any studies examining rhythm perception abilities in people who stutter; however, previous work has examined rhythm production abilities in this population. Studies comparing adults who stutter with controls on spontaneous or synchronize-continue tapping tasks have shown conflicting results; some finding group differences (e.g., Blackburn, 1931; C. J. Brown, Zimmermann, Linville, & Hegmann, 1990; Cooper & Allen, 1977), whereas others found no difference between the groups (e.g., Hulstijn, Summers, van Lieschout, & Peters, 1992; Max & Yudman, 2003; Zelaznik et al., 1994). Two studies conducted with children who stutter found mouth movements had greater timing variability (Howell, Au-Yeung, & Rustin, 1997) and clapping motions had more variable inter-clap-intervals (Olander, Smith, & Zelaznik, 2010) than typically-developing children. Both these studies suggest a fundamental deficit may exist in the ability to internally generate consistent rhythmic motor behaviors in children who stutter compared to typically-developing controls.
Although few studies have directly examined rhythm processing in individuals who stutter, rhythm processing has been examined in other clinical populations with known deficits in the BGTC network, such as in Parkinson’s disease (Grahn & Brett, 2009). A number of studies have shown that simple metrical rhythms with a strong beat (i.e., explicitly marked within the sounds) are better discriminated, remembered, and reproduced than complex metrical rhythms with a weak beat (i.e., at least partially induced by the listener) (e.g., Grahn, 2012; Grahn & Brett, 2007; Povel & Essens, 1985). Consistent with the involvement of the BGTC network in rhythm processing and temporal prediction, Grahn and Brett (2009) showed that individuals with Parkinson’s disease exhibit poorer rhythm discrimination and a reduced beat-based advantage compared with age-matched controls.
Stuttering is similar to Parkinson’s disease in that initiation and duration of movement execution are affected; specifically movements associated with speech production are affected in stuttering. Moreover, individuals who stutter may show a rhythm discrimination deficit similar to that observed for individuals with Parkinson’s disease, given recent evidence of differences in the BGTC network in children (Chang & Zhu, 2013) and adults who stutter (Chang et al., 2011; Lu et al., 2010) compared to controls in areas previously shown to support rhythm processing (Grahn & Rowe, 2009). If so, these findings would support the hypothesis that people who stutter may have a deficit in rhythm processing.
To address this possibility, we compared auditory rhythm discrimination in children who stutter to typically-developing controls using a child-friendly version of the rhythm discrimination paradigm used by Grahn and Brett (2009). Based on previous research showing attenuated functional connectivity in the BGTC network in children who stutter compared to typically-developing controls (Chang & Zhu, 2013), we hypothesized that children who stutter would show worse rhythm discrimination than their matched controls. If so, this result would provide the first evidence of a rhythm perception deficit in developmental stuttering and support the view that a rhythm processing deficit may underlie developmental stuttering. Moreover, we hypothesized that the predicted group difference in overall rhythm discrimination may be larger for complex rhythms than simple rhythms because discrimination of the former may possibly rely more on internal beat generation than the latter.
2. Methods
2.1. Participants
Participants were 17 children who stutter (CWS; 9 F, 8 M; age: M = 8.70 years, SD = 1.55) and 17 typically-developing controls (9 F, 8 M; age: M = 8.79 years, SD = 1.53) ranging from 6.08 to 11.42 years of age (see Table 1). The children were recruited through the Speech Neurophysiology Lab at Michigan State University. All children underwent careful screening to ensure normal speech and language development and typical developmental history except for the presence of stuttering in the stuttering group (see Table 1). Participants were monolingual, native speakers of English, with normal hearing, and without concomitant developmental disorders such as dyslexia, ADHD, learning delay, or other confirmed developmental or psychiatric conditions. The parents also confirmed that no child was taking any medication affecting the central nervous system. The children who stutter and typically-developing controls were matched in chronological age, and did not differ in socioeconomic status (Hollingshead, 1975).
Table 1.
Average (SD) Scores for the Measures Collected Relating to Background, Disfluencies, Speech, Language and Cognitive Tests
| Measure | Control | Stuttering | t(32) | p (two-tail) |
|---|---|---|---|---|
| Child’s age (years) | 8.79 (1.53) | 8.70 (1.55) | 0.176 | 0.861 |
| Edinburgh handedness quotient | 75.65 (39.88) | 59.06 (56.82) | 0.985 | 0.332 |
| Mother’s Education (years) | 6.12 (0.70) | 6.41 (0.62) | −0.302 | 0.202 |
|
| ||||
| Wechsler Abbreviated Scale of IQ (WASI) Full IQ score | 112.18 (15.36) | 106.18 (13.62) | 1.201 | 0.237 |
| WASI Performance IQ score | 111.65 (16.21) | 107.88 (11.52) | 0.780 | 0.441 |
| WASI Verbal IQ score | 110.82 (14.10) | 103.29 (14.52) | 1.534 | 0.135 |
| Peabody Picture Vocabulary Test (PPVT-4) score | 108.88 (7.10) | 105.94 (8.89) | 1.066 | 0.294 |
| Expressive Vocabulary Test (EVT-2) score | 110.24 (8.95) | 101.35 (10.56) | 2.645 | 0.013 |
| Goldman-Fristoe Test of Articulation (GFTA-2) score | 100.18 (7.60) | 102.00 (5.27) | −0.813 | 0.422 |
| Receptive Language Quotient score (based on TOLD or TACL) | 13.47 (5.15) | 11.18 (4.08) | 1.440 | 0.160 |
|
| ||||
| Percent of stuttering-like disfluencies | 0.81 (0.61) | 3.61 (2.79) | −4.036 | < .001 |
| Percent of other disfluencies | 4.07 (1.94) | 6.03 (2.52) | −1.761 | 0.088 |
| Stuttering Severity Instrument (SSI) | N/A | 16.76 (6.06) | N/A | N/A |
Research procedures were approved by the Michigan State University Institutional Review Board, and both the child and the parent signed informed consents. All participants were given nominal remuneration and small rewards (i.e., stickers) for participation.
2.2 Speech, Language, Hearing, and Cognitive Evaluation
Prior to participation in the current study, all participants were given a battery of standardized speech, language, and cognitive tests, audiometric hearing screening, oral-motor screening, and cognitive evaluations. The tests included the Peabody Picture Vocabulary Test (PPVT-4), Expressive Vocabulary Test (EVT-2), Goldman-Fristoe Test of Articulation (GFTA-2), intelligence test (Wechsler Preschool and Primary Scale of Intelligence, WPPSI-III, ages 3;0–7;0; or Wechsler Abbreviated Scale of Intelligence, WASI, ages 7;0–12;0) and receptive language test (subtests within the Test of Language Development, TOLD-P:3, ages 4;0–8;11; TOLD-I4, ages 9;0–12;0; or Test for Auditory Comprehension of Language, TACL-3, ages 4;0 to 8;11). Potential participants were excluded from the current study if his or her scores on any of these standardized tests were below two standard deviations of the mean.
Stuttering severity was assessed off-line by reviewing video recorded samples of speech, elicited through storytelling and conversational tasks with a certified Speech-Language Pathologist or a trained Masters student assistant. These speech samples were transcribed for further off-line analyses. The Stuttering Severity Instrument (SSI-4) was used to assess stuttering severity by considering percent frequency and duration of stuttering-like disfluencies, and physical concomitants associated with stuttering, derived from a minimum of 500 syllable speech sample recorded while the child engaged in conversations with a clinician. To be considered stuttering, the children had to exhibit 3% or more stuttering-like disfluencies in their speech sample, score at least very mild on the SSI, and the parent(s) had to express concern due to stuttering behavior. These measures were incorporated into a composite stuttering severity rating (SSI total score range: 8–29). To determine measurement reliability of the SSI score ratings, an intra-class correlation (ICC) coefficient was calculated based on the two independent judges’ ratings of SSI on a larger sample of children, from which pool the current participants were recruited. The ICC based on 37 samples was very high, with Cronbach’s alpha = 0.97.
2.3. Stimuli
Stimuli were seven simple and seven complex rhythms selected from a larger set of simple and complex rhythms (Grahn & Brett, 2009); see Table 2. Rhythms were five, six, or seven intervals long and all intervals within a rhythm were integer multiples of a base time unit, notated in Table 2 by a ‘1’. Notated values of two, three, and four indicate that the temporal intervals were two-times, three-times, or four-times the duration of the base unit, respectively. The base unit will hereafter be referred to as the base inter-onset-interval (IOI) as it indicates the time interval between successive tone onsets delineating the interval. Base IOI varied randomly from trial to trial between 165 ms and 205 ms in 8 ms increments.
Table 2.
Table of Simple and Complex Rhythm Sequences Used in the Study and Split by Interval
| Simple
|
Complex
|
|||
|---|---|---|---|---|
| Standard | Different | Standard | Different | |
| 5 intervals | 31422 | 13422 | 23241 | 23214 |
| 41331 | 43131 | 33141 | 31341 | |
|
| ||||
| 6 intervals | 211413 | 211431 | 214221 | 214212 |
| 311322 | 313122 | 321411 | 324111 | |
| 422112 | 422211 | 421311 | 412311 | |
|
| ||||
| 7 intervals | 1122114 | 1121124 | 1132131 | 1131231 |
| 2211114 | 2112114 | 2141211 | 2142111 | |
For simple rhythms, intervals were organized into a sequence designed to elicit an explicit periodic accent every four base IOI’s, which was predicted to induce the strong perception of a periodic beat (Povel & Essens, 1985). In contrast, intervals comprising the complex rhythms were organized into a sequence so that the accents were not periodic, and thus were not expected to induce the perception of a periodic beat. Each simple rhythm had a corresponding complex rhythm that was matched in the number of intervals. The ‘different’ variant of a rhythm involved swapping the order of a pair of adjacent intervals; different rhythms were the same as those used in Grahn and Brett (2009).
2.4. Apparatus
The experiment was presented to participants using E-Prime v2.0 Professional (Psychology Software Tools, Inc.) running on a Lenovo Thinkpad laptop, Intel® Core™ i5 CPU with a 15-inch screen. Sounds were presented over a Logitech Compact Speaker System Z320 at a comfortable listening level, and responses were made by pressing marked buttons on the keyboard.
2.5. Procedure
On each trial, the child heard two successive presentations of a standard rhythm and was then asked to judge whether a third (comparison) rhythm was the same or different from the standard. The task was presented in the context of a computer game, where on each trial “Randy Drummer” played a standard rhythm two times and then either the same rhythm played back to Randy by his twin brother “Sandy Same,” or a different rhythm played back by his friend “Doggy Different.” The child was instructed to indicate whether the third rhythm was being played by Sandy Same (who played the same rhythm) or Doggy Different (who played a different rhythm) by pressing the respective button on the keyboard, which was marked with a visual representation of the two different characters (see Figure 2). The IOI between presentations of each rhythm was 1100 ms, the child was given an unlimited response time and the next trial began immediately after a response. Response side-associations were counterbalanced across participants.
Figure 2.
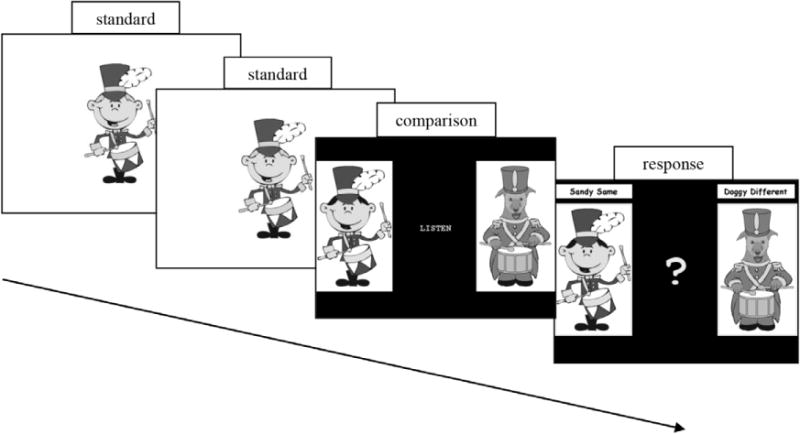
Stimuli used in the experiment. The standard rhythm was played twice by Randy, then the comparison rhythm was either same or different, then the participant answered Sandy Same or Doggy Different.
The experiment started with four practice trials, consisting of same and different variants of one simple rhythm and one complex rhythm, which were not used during the test trials. The practice was followed by 28 test trials where children heard same and different variants of seven simple and seven complex rhythms. Correct/incorrect feedback was provided after each practice trial, but not during the test trials. During the experiment, six short breaks were given after every fourth trial, during which children were told that they were doing well and had earned a sticker as positive reinforcement. The frequency of the tones marking the rhythms also varied randomly from trial to trial and took on one of six values: 294, 353, 411, 470, 528, or 587 Hz. The entire experimented lasted approximately 20 minutes.
2.6. Data Analysis
Performance on the rhythm discrimination task was assessed using a signal detection analysis to distinguish between participants’ ability to discriminate same and different rhythms from any general tendency to respond same or different (Macmillan & Creelman, 2005). Responding ‘different’ on trials when the comparison was different from the standard was treated as a ‘hit’ and responding ‘different’ on trials when the comparison was the same as the standard was treated as a ‘false alarm’. Hit rates (HR’s) and false alarm rates (FAR’s) were then used to calculate d′ (a measure of sensitivity) and the response criterion c (a measure of response bias) for simple and complex rhythms for each participant. Sensitivity, d′, is determined by z(HR) – z(FAR), and the criterion, c, is determined by −0.5*[z(HR) + z(FAR)]. Values of d′ = 0 correspond to chance performance, with larger values corresponding to better discrimination. Values of c = 0 indicates no response bias, with negative values of c indicating a liberal response strategy (i.e., a tendency to respond ‘different’), and positive values of c indicating a conservative response strategy (i.e., a tendency to respond ‘same’). Separate 2 (Group: children who stutter, typically-developing controls) × 2 (Rhythm Type: simple, complex) ANOVA’s were conducted on d′ and c with Group as a between-subjects factor and Rhythm Type as within-subject factor.
3. Results
Table 1 shows the means and standard deviations for the measures of standardized speech, language, and cognitive tests. As expected, the two groups differed in the percentage of stuttering-like disfluencies during speech production, t(32) = −4.036, p < .001. Moreover, the groups did not differ on IQ or on speech-language measures; the one exception was that typically-developing children had slightly higher expressive vocabulary scores than children who stutter (EVT-2), t(32) = 2.645, p = .013.
Figure 3 shows mean d′ scores for the simple and complex rhythms for the typically-developing children and the children who stutter. An ANOVA on d′ revealed better discrimination of simple rhythms (M = 1.76, SD = 1.01) than complex rhythms (M = 1.40, SD = 1.08), F(1,32) = 5.015, p = .032, ηp2 = .135. There was also a significant main effect of Group; children who stutter (M = 1.23, SD = 1.01) showed worse rhythm discrimination than typically-developing children (M = 1.93, SD = 1.00), F(1,32) = 5.386, p = .027, ηp2 = .144. Although there was a tendency for a larger performance difference between groups for complex rhythms (children who stutter: M = 0.97, SD = 0.95; typically-developing children: M = 1.84, SD = 1.05) than for simple rhythms (children who stutter: M = 1.49, SD = 1.00; typically-developing children: M = 2.03, SD = 0.97), the interaction between Rhythm Type and Group was not significant, F(1,32) = 1.105, p = .301, ηp2 = .033.
Figure 3.
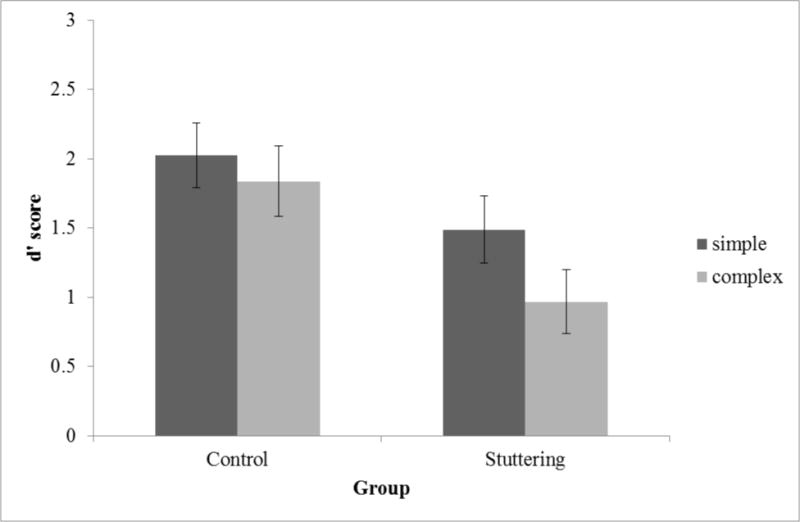
Mean d′ for the typically-developing controls and children who stutter (Stuttering) groups. Error bars show mean ± 1 SEM.
Figure 4 shows the mean response criterion, c, for simple and complex rhythms for the typically-developing children and the children who stutter. An ANOVA on c revealed that the children tended to respond ‘same’ slightly more often to complex rhythms (M = 0.29, SD = 0.38) than to simple rhythms (M = 0.16, SD = 0.32), F(1,32) = 4.605, p = .040, ηp2 = .126. No significant main effect of Group was found (children who stutter: M = 0.23, SD = 0.45; typically-developing children: M = 0.22, SD = 0.23; F(1,32) = 0.007, p = .935, ηp2 < .001), nor was there a significant interaction between Group and Rhythm Type (F(1,32) = 0.692, p = .411, ηp2 = .021).
Figure 4.

Mean c for the typically-developing controls and children who stutter (Stuttering) groups. Error bars show mean ± 1 SEM.
4. Discussion
This study examined rhythm discrimination abilities of children who do and do not stutter. Based on our hypothesis that children who stutter may have difficulty internally generating a rhythm and maintaining a beat, we predicted that they would show worse auditory rhythm discrimination compared to typically-developing children and that the group difference in overall rhythm discrimination might be larger for complex rhythms than simple rhythms. Consistent with an overall rhythm perception deficit in developmental stuttering, children who stutter showed markedly worse rhythm discrimination compared to matched typically-developing children, but the interaction between Group and Rhythm Type was not significant. This lack of an interaction does not support the hypothesis of a larger group difference for complex rhythms than for simple rhythms.
Rhythm discrimination ability between groups was not accounted for by differences in cognitive ability or most language ability measures. The one language ability measure that demonstrated lower scores for children who stutter was the expressive vocabulary test (EVT). This expressive vocabulary difference is consistent with previous studies that have demonstrated within normal range, but slightly lower, performance on several standardized language measures for children who stutter compared with age-matched peers (e.g., Anderson, Pellowski, & Conture, 2005; Coulter, Anderson, & Conture, 2009; Ratner & Silverman, 2000). One possibility is that children who stutter that have lower expressive language ability may represent a particular subtype of developmental stuttering (Seery, Watkins, Mangelsdorf, & Shigeto, 2007). To explore whether the observed rhythm perception deficit is driven by children who stutter with lower EVT scores, we performed a median split on expressive language scores and then compared the rhythm discrimination of children who do and do not stutter for the top half of the distribution. Notably, for children in the upper 50% on the EVT scores (thus excluding those children with lower EVT scores), the children who stutter still showed worse rhythm discrimination than typically developing children, t(15) = 1.9, p < .05, one-tailed. Moreover, for the children in the top half of the EVT scores, the children who stutter and typically-developing children do not reliably differ in their expressive language EVT scores. Although further research is needed to address this issue in full, it seems unlikely that the observed rhythm perception deficit in developmental stuttering is driven by differences between groups in their expressive vocabulary abilities.
We are not aware of any studies that have examined rhythm perception abilities in people who stutter; however, a sizeable body of work has examined rhythm production abilities in this population. Of this work, almost all has been conducted with adults using speech or non-speech tasks, commonly using self-paced rhythmic production or externally paced synchronize-continue motor timing paradigms. During self-paced tasks, participants are asked to produce a continuous rhythm (e.g., repeatedly tapping a finger or producing a speech sound) without the aid of external timing cues (e.g., Blackburn, 1931; C. J. Brown et al., 1990). Conversely, during synchronize-continue tasks participants are asked to produce movements in synchrony with an external rhythmic pacing signal (e.g., a metronome) and then continue producing those movements at the same rate once the signal stops (e.g., Hulstijn et al., 1992; Zelaznik et al., 1994).
The results of production studies with adults who stutter using self-paced paradigms reveal a mixed picture for both speech and non-speech tasks. Cooper and Allen (1977) showed that adults who stutter exhibit overall greater timing variability compared with adults who do not stutter in controlling rate when asked to steadily tap with a finger, as well as steadily reading passages aloud. However, Blackburn (1931) found no significant differences in voluntary rhythmic movements of tapping at three taps per second when comparing adults who do and do not stutter, although he did find worse performance in adults who stutter when asked to move their tongue or jaw at a steady pace. Moreover, Brown and colleagues (1990) reported less variable timing in both speech (i.e., steadily producing “ah”) and non-speech (i.e., steadily finger tapping or jaw opening/closing) tasks for adults who stutter compared to those that do not. The researchers viewed this difference as an indication of a less flexible timing system in adults who stutter compared to fluent adults (C. J. Brown et al., 1990). These differences in results likely reflect variability in experimental conditions (e.g., rates of tapping, differences in equipment) or participant characteristics (e.g., stuttering therapy history, age, sex).
The results of production studies with adults who stutter using externally-paced paradigms have generally revealed no group differences in either the mean accuracy or variability during both non-speech and speech tasks. These studies with synchronize-continue tasks have a wide range of production rates from 200 to 850 ms, but did not reveal group differences (Hulstijn et al., 1992; Max & Yudman, 2003; Zelaznik et al., 1994). The exception to this lack of group difference seems to arise when the task becomes more difficult by incorporating consecutive speech and non-speech tasks, which results in larger variation in adults who stutter compared to those who do not (Hulstijn et al., 1992). This finding is consistent with the view that motor timing differences that are (or are not) found between individuals who do and do not stutter may depend on the task complexity (Boutsen, Brutten, & Watts, 2000; Max, Caruso, & Gracco, 2003). Another possibility is that some of the differences between studies may be due to possible subgroups within the stuttering population (Barasch, Guitar, McCauley, & Absher, 2000; Blackburn, 1931; C. J. Brown et al., 1990).
Relatively few studies of timing production have been conducted with children who stutter; those that have similarly involve variants of synchronize-continue tapping tasks. Howell and colleagues (1997) compared children who do and do not stutter aged 9 to 10 years using a synchronize-continue task that involved non-speech mouth movements ranging from 833 to 1333 ms. Children who stutter demonstrated greater timing variability than children who do not stutter. More recently, Olander and colleagues (2010) studied younger children aged 4 to 6 years clapping in time with a metronome set at a 600 ms inter-clap-interval; the children were then asked to continue clapping at the same rate. The young children who stutter did not reliably differ from controls in mean clapping rate; however, during the continuation phase of the task (i.e., when the external timing cues were removed), children who stutter produced significantly more variable inter-clap-intervals than the control participants. The authors suggested that their results support a fundamental deficit in children who stutter in their ability to internally generate consistent rhythmic motor behaviors.
Examining rhythm perception ability in children who stutter is a valid way to elucidate possible neuropathophysiological bases of stuttering given a large body of literature showing tight integration of auditory-motor systems that are common for speech (Cai, Beal, Ghosh, Guenther, & Perkell, 2014; Hickok, Houde, & Rong, 2011; Wilson, Saygin, Sereno, & Iacoboni, 2004) and rhythm perception and production (e.g., Chen, Penhune, & Zatorre, 2008; Grahn & Brett, 2007; Grahn & Rowe, 2009). Thus any significant differences in rhythm perception ability is likely not independent of rhythm production ability, and further, not independent of speech production skills that involve rhythmic movements. The present study with children who stutter is the first experiment we are aware of that explicitly examines rhythm perception without having a motor component in the task. The present findings thus contribute to the extant literature on neurodevelopmental stuttering by revealing for the first time a rhythm perception difference between children who do and do not stutter.
In a study combining fMRI and a rhythm perception task shown to be diagnostic of individual differences in beat perception, Grahn and McAuley (2009) demonstrated the involvement of the BGTC network, including the putamen, supplementary motor area (SMA), premotor cortex (PMC), and insula. When participants were presented with a sequence of tones, “strong” beat perceivers (those able to internalize the rhythm and infer a beat) showed increased activity in the left PMC, insula, and SMA, whereas “weak” beat perceivers showed more activity in the left superior/middle temporal gyri (STG/MTG) and right PMC. The neural circuits that distinguish the strong and weak beat perceivers correspond to those circuits that have been shown to support internal (SMA, PMC, insula) versus external (left STG/MTG, right PMC) timing. Interestingly, theoretical perspectives on stuttering have proposed that people who stutter may have deficiencies in internal timing networks, which may be compensated for by the external timing networks during paced speech tasks (Alm, 2004; Etchell et al., 2014). Functional neuroimaging studies have often reported aberrant activity patterns involving all of these areas in people who stutter (Braun et al., 1997; Chang et al., 2011; Fox et al., 2000). In an fMRI study that involved both internally paced (i.e., reading) and externally paced (i.e., metronome, choral speech) speech, Toyomura and colleagues (2011) found decreased activity during internally generated speech for stuttering speakers relative to controls in the bilateral basal ganglia, left precentral gyrus, left insula, left SMA, and left IFG, but all achieved comparable activity levels to controls during the metronome task. In addition, activity in the bilateral STG increased to a greater extent than that in controls during the same condition during the paced speech conditions. These results seem to indicate that this network of regions supporting rhythm and timing may be affected in stuttering, and could contribute to the etiology of stuttering.
The present results corroborate a recent resting-state fMRI study where functional connectivity among regions in the BGTC network, particularly between putamen and the supplementary motor area (SMA), was shown to be significantly decreased in children who stutter compared to age-matched controls during a task-free rest condition (Chang & Zhu, 2013). Temporal asynchrony in regions of cortical-subcortical networks that support internal timing could further lead to disruption of normal interaction with cortical sensorimotor areas, including premotor, motor, and auditory regions that support speech production. Given the findings of BGTC functional connectivity decreases during rest, and behavioral findings of attenuated rhythm perception in stuttering children, we may speculate that functional connectivity among BGTC networks develop anomalously in children who stutter. This may affect internal timing mechanisms that support rhythm processing that may in turn disturb timing of fluent speech sequences. As stuttering persists onto adulthood, abnormally heightened activity in some of the cortical-subcortical areas, as have been found in previous studies (Braun et al., 1997; Fox et al., 1996; Giraud et al., 2008), may become apparent as a result of a continued lack of coordination among regions of this BGTC network.
Finally, we speculate that a deficit in internally generating a rhythm and maintaining a beat could lead to stuttering-like disfluencies even when to-be-produced speech is not overtly rhythmic. Multiple lines of evidence support the idea that rhythmic structures similar to the ones used in this study are relevant both to speech production and perception. Regarding speech production, it is widely posited that production stems from inherently rhythmic planning and coordination structures at different time scales (e.g., sub-syllabic, syllabic, phrase) (Barbosa, 2007; Byrd & Saltzman, 2003; Cummins & Port, 1998; Jones, 1976; Large & Jones, 1999; McAuley & Jones, 2003; Nam, Goldstein, & Saltzman, 2006; Port, 2003), and these activities have been proposed to involve actions of oscillators with inherent periodicity (e.g., Barbosa, 2007; Cummins & Port, 1998; Large & Jones, 1999). The idea that speech communication hinges on the actions of periodic oscillatory mechanisms for timing and action coordination is supported by evidence that neurons show spontaneous oscillatory firing patterns in various frequency ranges, which are modulated by the rhythmic properties of speech (i.e., amplitude envelope) (Giraud & Poeppel, 2012; Rosen, 1992; Zion Golumbic, Poeppel, & Schroeder, 2012). The rhythmic sense of beat in speech has been proposed to be the main coordinating level of speech production planning (e.g., Martin, 1972). Although produced speech is seldom overtly rhythmic due to various situational factors (Cummins & Port, 1998; Hawkins, 2014; Tilsen, 2013; Wagner & Watson, 2010), clear evidence exists for the relevance of the regular rhythmic structures for fluent speech production. These considerations suggest that planning speech rhythm constitutes part of the feedforward process for speech production (Levelt, 1993).
The sorts of rhythmic structures used in this study are also relevant for speech perception, where stressed syllables are inherently rhythmic and (quasi-)periodic (Lehiste, 1977; Patel, 2007; Selkirk, 1984). Importantly, recent findings indicate that hearing speech induces rhythmic expectations that influence responses to subsequent speech (Dilley & Pitt, 2010; Morrill, Dilley, & McAuley, 2014). These rhythmic perceptual expectations include information about the lexical stress and metrical organization of upcoming speech material (M. Brown, Salverda, & Dilley, in press). For example, Brown and colleagues (in press) manipulated the prosodic properties of context speech syllables to induce different rhythms, and found that the pitch and timing characteristics of stressed syllables prior to a target word affected listeners’ expectations about the stress pattern of the target word itself. These findings, together with other results (Dilley & McAuley, 2008; Dilley & Pitt, 2010; Morrill et al., 2014), show that perceptual information about the timing of speech is used to form predictions about the appropriate rhythmic structure of speech. In other words, perceptual information about speech rhythm constitutes part of the feedback information received during speech monitoring that is used to evaluate subsequent speech. This is consistent with findings that pitch and timing manipulations imposed on auditory feedback of self-produced speech are actively monitored and result in adjustments to speech production (e.g., Cai et al., 2014; Larson, 1998; Loucks, Chon, & Han, 2012). Multiple studies have linked stuttering to abnormalities in the integration of auditory error with ongoing articulation and phonation (Cai et al., 2012; Foundas et al., 2004; Kalinowski, Armson, Stuart, & Gracco, 1993), particularly with respect to abnormalities in correcting error in connected speech timing (e.g., Cai et al., 2014) and fundamental frequency (e.g., Kalinowski et al., 1993). In other words, it appears that the normal processes of integration of perceptual error feedback and production of ongoing speech may be disrupted in people who stutter.
Our account of a causal link between rhythm processing deficiencies and stuttering focuses on the rhythmic aspects of speech production and perception, building on the arguments for the role of rhythm in relation to both speech production and perception. Thus, deficiencies in rhythm processing that affect either the rhythmic structure generation during speech production planning (Barbosa, 2007; Cummins & Port, 1998), or else the apprehension of rhythmic expectations during speech perception (cf. M. Brown et al., in press; Dilley & McAuley, 2008), may be responsible for disruptions to the normal balance between rhythmic aspects of feedforward and feedback mechanisms during speech production and speech perception, respectively. On one hand, the rhythm processing deficit hypothesized here to be associated with stuttering could lead to insufficiently clear auditory feedback about the rhythmic structures that occurred in speech just produced and/or difficulty generating expectations about appropriate rhythmic structures that should follow. On the other hand, this rhythm processing deficit could be associated with insufficiently robust feedforward commands to the articulators about rhythmic structures to be produced next. Since production planning has been proposed to be based on periodic oscillator mechanisms (e.g., Barbosa, 2007; Cummins & Port, 1998), on this view a rhythm processing deficit would undermine the robustness of feedforward speech production commands, potentially leading to a washing out of this information by auditory feedback. These hypotheses can be tested in future experiments investigating the role of rhythmic information during speech production and perception in people who stutter.
5. Conclusion
We have provided the first evidence of a rhythm perception deficit in children with developmental stuttering. Children who stutter were less able to discriminate auditory rhythms than typically-developing children. These findings, combined with previous work showing greater temporal variability and attenuated functional connectivity within the BGTC network in children who stutter, suggest a deficit in rhythm processing in developmental stuttering that is consistent with a reduced ability to generate and/or maintain an internal beat. Such a rhythm perception deficit may underlie disruptions in performing internally-paced temporal control of movement, including fluent speech production.
Supplementary Material
Figure 1.

A schematic example of a stimulus sequence used in this study. The numbers represent the relative length of intervals in each sequence with 1 = 165–205 ms (value chosen at random on each trial) in steps of 8 ms.
Highlights.
We examined auditory rhythm discrimination in children who do and do not stutter.
Children who stutter showed worse rhythm discrimination compared to matched children who do not stutter.
These results provide the first evidence of a rhythm perception deficit in developmental stuttering.
This rhythm perception deficit may in turn affect internal timing of self-generated movement such as speech production.
Acknowledgments
We would like to thank Ashley Larva for help with speech transcriptions and disfluency analyses, and Kristin Hicks and Evamarie Burnham for their help with recruitment, scheduling, and testing. This project was funded by the National Institute on Deafness and other Communication Disorders (NIDCD) grant R01DC011277 (PI: Chang) and the GRAMMY Foundation (PI: McAuley).
Footnotes
Publisher's Disclaimer: This is a PDF file of an unedited manuscript that has been accepted for publication. As a service to our customers we are providing this early version of the manuscript. The manuscript will undergo copyediting, typesetting, and review of the resulting proof before it is published in its final citable form. Please note that during the production process errors may be discovered which could affect the content, and all legal disclaimers that apply to the journal pertain.
References
- Adams MR, Ramig P. Vocal characteristics of normal speakers and stutterers during choral reading. Journal of Speech, Language and Hearing Research. 1980;23(2):457–469. doi: 10.1044/jshr.2302.457. [DOI] [PubMed] [Google Scholar]
- Allen GD. Segmental timing control in speech production. Journal of Phonetics. 1973;1:219–237. [Google Scholar]
- Alm PA. Stuttering and the basal ganglia circuits: a critical review of possible relations. J Commun Disord. 2004;37(4):325–369. doi: 10.1016/j.jcomdis.2004.03.001. [DOI] [PubMed] [Google Scholar]
- Anderson JD, Pellowski MW, Conture EG. Childhood stuttering and dissociations across linguistic domains. J Fluency Disord. 2005;30(3):219–253. doi: 10.1016/j.jfludis.2005.05.006. [DOI] [PubMed] [Google Scholar]
- Andrews G, Craig A, Feyer AM, Hoddinott S, Howie P, Neilson M. Stuttering: A review of research findings and theories circa 1982. Journal of Speech and Hearing Disorders. 1983;48:226–246. doi: 10.1044/jshd.4803.226. [DOI] [PubMed] [Google Scholar]
- Barasch CT, Guitar B, McCauley RJ, Absher RG. Disfluency and time perception. Journal of Speech, Language and Hearing Research. 2000;43(6):1429–1439. doi: 10.1044/jslhr.4306.1429. [DOI] [PubMed] [Google Scholar]
- Barbosa P. From syntax to acoustic duration: A dynamical model of speech rhythm production. Speech Communication. 2007;49:725–742. [Google Scholar]
- Blackburn B. Voluntary movements of the organs of speech in stutterers and non-stutturers. Psychological Monographs. 1931;41(4):1–13. [Google Scholar]
- Boutsen FR, Brutten GJ, Watts CR. Timing and intensity variability in the metronomic speech of stuttering and nonstuttering speakers. Journal of Speech, Language and Hearing Research. 2000;43(2):513–520. doi: 10.1044/jslhr.4302.513. [DOI] [PubMed] [Google Scholar]
- Braun AR, Varga M, Stager S, Schulz G, Selbie S, Maisog JM, Ludlow CL. Altered patterns of cerebral activity during speech and language production in developmental stuttering. An H2 (15) O positron emission tomography study. Brain. 1997;120(5):761–784. doi: 10.1093/brain/120.5.761. [DOI] [PubMed] [Google Scholar]
- Brown CJ, Zimmermann GN, Linville RN, Hegmann JP. Variations in self-paced behaviors in stutterers and nonstutterers. Journal of Speech & Hearing Research. 1990;33:317–323. doi: 10.1044/jshr.3302.317. [DOI] [PubMed] [Google Scholar]
- Brown M, Salverda AP, Dilley LC. Metrical expectations from preceding prosody influence spoken word recognition. Journal of Experimental Psychology: Human Perception and Performance. doi: 10.1037/a0038689. (in press) [DOI] [PMC free article] [PubMed] [Google Scholar]
- Byrd D, Saltzman E. The elastic phrase: modeling the dynamics of boundary-adjacent lengthening. Journal of Phonetics. 2003;31:149–180. [Google Scholar]
- Cai S, Beal DS, Ghosh SS, Guenther FH, Perkell JS. Impaired timing adjustments in response to time-varying auditory perturbation during connected speech production in persons who stutter. Brain Lang. 2014;129:24–29. doi: 10.1016/j.bandl.2014.01.002. [DOI] [PMC free article] [PubMed] [Google Scholar]
- Cai S, Beal DS, Ghosh SS, Tiede MK, Guenther FH, Perkell JS. Weak responses to auditory feedback perturbation during articulation in persons who stutter: evidence for abnormal auditory-motor transformation. PLoS One. 2012;7(7):e41830. doi: 10.1371/journal.pone.0041830. [DOI] [PMC free article] [PubMed] [Google Scholar]
- Chang SE, Horwitz B, Ostuni J, Reynolds R, Ludlow CL. Evidence of left inferior frontal-premotor structural and functional connectivity deficits in adults who stutter. Cerebral Cortex. 2011;21(11):2507–2518. doi: 10.1093/cercor/bhr028. [DOI] [PMC free article] [PubMed] [Google Scholar]
- Chang SE, Zhu D. Neural network connectivity differences in children who stutter. Brain. 2013;136(12):3709–3726. doi: 10.1093/brain/awt275. [DOI] [PMC free article] [PubMed] [Google Scholar]
- Chen JL, Penhune VB, Zatorre RJ. Listening to musical rhythms recruits motor regions of the brain. Cerebral Cortex. 2008;18(12):2844–2854. doi: 10.1093/cercor/bhn042. [DOI] [PubMed] [Google Scholar]
- Cooper MH, Allen GD. Timing control accuracy in normal speakers and stutterers. Journal of Speech, Language and Hearing Research. 1977;20(1):55–71. doi: 10.1044/jshr.2001.55. [DOI] [PubMed] [Google Scholar]
- Coulter CE, Anderson JD, Conture EG. Childhood stuttering and dissociations across linguistic domains: a replication and extension. J Fluency Disord. 2009;34:257–278. doi: 10.1016/j.jfludis.2009.10.005. [DOI] [PMC free article] [PubMed] [Google Scholar]
- Cummins F. Rhythm as entrainment: The case of synchronous speech. Journal of Phonetics. 2009;37(1):16–28. [Google Scholar]
- Cummins F, Port R. Rhythmic constraints on stress timing in English. Journal of Phonetics. 1998;26(2):145–171. [Google Scholar]
- Dilley LC, McAuley JD. Distal prosodic context affects word segmentation and lexical processing. Journal of Memory and Language. 2008;59(3):294–311. [Google Scholar]
- Dilley LC, Pitt MA. Altering context speech rate can cause words to appear or disappear. Psychological Science. 2010;21(11):1664–1670. doi: 10.1177/0956797610384743. [DOI] [PubMed] [Google Scholar]
- Dilley LC, Wallace J, Heffner C. Perceptual isochrony and fluency in speech by normal talkers under varying task demands. In: Niebuhr O, Pfitzinger H, editors. Prosodies: Context, Function, and Communication. Berlin/New York: Walter deGruyter; 2012. pp. 237–258. [Google Scholar]
- DiSimoni FG. Preliminary study of certain timing relationships in the speech of stutterers. J Acoust Soc Am. 1974;56(2):695–696. doi: 10.1121/1.1903313. [DOI] [PubMed] [Google Scholar]
- Etchell AC, Johnson BW, Sowman PF. Behavioral and multimodal neuroimaging evidence for a deficit in brain timing networks in stuttering: A hypothesis and theory. Frontiers in Human Neuroscience. 2014;8 doi: 10.3389/fnhum.2014.00467. [DOI] [PMC free article] [PubMed] [Google Scholar]
- Foundas AL, Bollich AM, Feldman J, Corey DM, Hurley M, Lemen LC, Heilman KM. Aberrant auditory processing and atypical planum temporale in developmental stuttering. Neurology. 2004;63(9):1640–1646. doi: 10.1212/01.wnl.0000142993.33158.2a. [DOI] [PubMed] [Google Scholar]
- Fox PT, Ingham RJ, Ingham JC, Hirsch TB, Downs JH, Martin C, Lancaster JL. A PET study of the neural systems of stuttering. Nature. 1996;382:158–162. doi: 10.1038/382158a0. [DOI] [PubMed] [Google Scholar]
- Fox PT, Ingham RJ, Ingham JC, Zamarripa F, Xiong JH, Lancaster JL. Brain correlates of stuttering and syllable production A PET performance-correlation analysis. Brain. 2000;123(10):1985–2004. doi: 10.1093/brain/123.10.1985. [DOI] [PubMed] [Google Scholar]
- Giraud AL, Neumann K, Bachoud-Levi AC, von Gudenberg AW, Euler HA, Lanfermann H, Preibisch C. Severity of dysfluency correlates with basal ganglia activity in persistent developmental stuttering. Brain Lang. 2008;104(2):190–199. doi: 10.1016/j.bandl.2007.04.005. [DOI] [PubMed] [Google Scholar]
- Giraud AL, Poeppel D. Cortical oscillations and speech processing: Emerging computational principles and operations. Nature Neuroscience. 2012;15(4):511–517. doi: 10.1038/nn.3063. [DOI] [PMC free article] [PubMed] [Google Scholar]
- Glover H, Kalinowski J, Rastatter M, Stuart A. Effect of instruction to sing on stuttering frequency at normal and fast rates. Perceptual and Motor Skills. 1996;83:511–522. doi: 10.2466/pms.1996.83.2.511. [DOI] [PubMed] [Google Scholar]
- Grahn JA. The role of the basal ganglia in beat perception: neuroimaging and neuropsychological investigations. Ann N Y Acad Sci. 2009;1169:35–45. doi: 10.1111/j.1749-6632.2009.04553.x. [DOI] [PubMed] [Google Scholar]
- Grahn JA. Neural mechanisms of rhythm perception: current findings and future perspectives. Top Cogn Sci. 2012;4(4):585–606. doi: 10.1111/j.1756-8765.2012.01213.x. [DOI] [PubMed] [Google Scholar]
- Grahn JA, Brett M. Rhythm and beat perception in motor areas of the brain. Journal of Cognitive Neuroscience. 2007;19(5):893–906. doi: 10.1162/jocn.2007.19.5.893. [DOI] [PubMed] [Google Scholar]
- Grahn JA, Brett M. Impairment of beat-based rhythm discrimination in Parkinson’s disease. Cortex. 2009;45(1):54–61. doi: 10.1016/j.cortex.2008.01.005. [DOI] [PubMed] [Google Scholar]
- Grahn JA, McAuley JD. Neural bases of individual differences in beat perception. Neuroimage. 2009;47(4):1894–1903. doi: 10.1016/j.neuroimage.2009.04.039. [DOI] [PubMed] [Google Scholar]
- Grahn JA, Rowe JB. Feeling the beat: premotor and striatal interactions in musicians and nonmusicians during beat perception. The Journal of Neuroscience. 2009;29(23):7540–7548. doi: 10.1523/JNEUROSCI.2018-08.2009. [DOI] [PMC free article] [PubMed] [Google Scholar]
- Hawkins S. Situational influences on rhythmicity in speech, music, and their interaction. Philosophical Transactions of the Royal Society B: Biological Sciences. 2014;369(1658):20130398. doi: 10.1098/rstb.2013.0398. [DOI] [PMC free article] [PubMed] [Google Scholar]
- Hickok G, Houde J, Rong F. Sensorimotor integration in speech processing: computational basis and neural organization. Neuron. 2011;69(3):407–422. doi: 10.1016/j.neuron.2011.01.019. [DOI] [PMC free article] [PubMed] [Google Scholar]
- Hollingshead AB. Four factor index of social status. New Haven, Conn: Yale University; 1975. [Google Scholar]
- Howell P, Au-Yeung J, Rustin L. Clock and motor variances in lip-tracking: A comparison between children who stutter and those who do not. In: Hulstijn W, Peters HFM, v Lieshout PHHM, editors. Speech Production: Motor Control, Brain Research and Fluency Disorders. Elsevier Science B.V; 1997. pp. 573–578. [Google Scholar]
- Hulstijn W, Summers JJ, van Lieschout PH, Peters HF. Timing in finger tapping and speech: A comparison between stutterers and fluent speakers. Hum Mov Sci. 1992;11(1):113–124. [Google Scholar]
- Ingham RJ, Carroll PJ. Listener judgment of differences in stutterers’ nonstuttered speech during chorus-and nonchorus-reading conditions. Journal of Speech, Language and Hearing Research. 1977;20(2):293–302. doi: 10.1044/jshr.2002.293. [DOI] [PubMed] [Google Scholar]
- Jones MR. Time, our lost dimension: Toward a new theory of perception, attention, and memory. Psychological Review. 1976;83(5):323–355. [PubMed] [Google Scholar]
- Kalinowski J, Armson J, Stuart A, Gracco VL. Effects of alterations in auditory feedback and speech rate on stuttering frequency. Language and Speech. 1993;36(1):1–16. doi: 10.1177/002383099303600101. [DOI] [PubMed] [Google Scholar]
- Kent RD. Stuttering as a temporal programming disorder. In: Curlee RF, Perkins WH, editors. Nature and treatment of stuttering: New directions. San Diego: College-Hill Press; 1984. pp. 283–301. [Google Scholar]
- Large EW, Jones MR. The dynamics of attending: how people track time-varying events. Psychological Review. 1999;106(1):119–159. [Google Scholar]
- Larson CR. Cross-modality influences in speech motor control: the use of pitch shifting for the study of F0 control. J Commun Disord. 1998;31(6):489–503. doi: 10.1016/s0021-9924(98)00021-5. [DOI] [PubMed] [Google Scholar]
- Lehiste I. Isochrony reconsidered. Journal of Phonetics. 1977;5:253–263. [Google Scholar]
- Levelt WJ. Speaking: From intention to articulation. Vol. 1. MIT press; 1993. [Google Scholar]
- Loucks T, Chon H, Han W. Audiovocal integration in adults who stutter. International Journal of Language & Communication Disorders. 2012;47(4):451–456. doi: 10.1111/j.1460-6984.2011.00111.x. [DOI] [PubMed] [Google Scholar]
- Lu C, Peng D, Chen C, Ning N, Ding G, Li K, Lin C. Altered effective connectivity and anomalous anatomy in the basal ganglia-thalamocortical circuit of stuttering speakers. Cortex. 2010;46(1):49–67. doi: 10.1016/j.cortex.2009.02.017. [DOI] [PubMed] [Google Scholar]
- Macmillan NA, Creelman CD. Detection Theory: A user’s guide. 2. London: Lawrence Erlbaum Associates; 2005. [Google Scholar]
- Martin JG. Rhythmic (hierarchical) versus serial structure in speech and other behavior. Psychological Review. 1972;79(6):487–509. doi: 10.1037/h0033467. [DOI] [PubMed] [Google Scholar]
- Max L, Caruso AJ, Gracco VL. Kinematic analyses of speech, orofacial nonspeech, and finger movements in stuttering and nonstuttering adults. Journal of Speech, Language and Hearing Research. 2003;46:215–232. doi: 10.1044/1092-4388(2003/017). [DOI] [PubMed] [Google Scholar]
- Max L, Yudman EM. Accuracy and variability of isochronous rhythmic timing across motor systems in stuttering versus nonstuttering individuals. Journal of Speech, Language and Hearing Research. 2003;46(1):146–163. doi: 10.1044/1092-4388(2003/012). [DOI] [PubMed] [Google Scholar]
- McAuley JD. Music Perception. New York: Springer; 2010. Tempo and Rhythm; pp. 165–199. [Google Scholar]
- McAuley JD, Jones MR. Modeling effects of rhythmic context on perceived duration: A comparison of interval and entrainment approaches to short-interval timing. Journal of Experimental Psychology: Human Perception & Performance. 2003;29(6):1102–1125. doi: 10.1037/0096-1523.29.6.1102. [DOI] [PubMed] [Google Scholar]
- Morrill T, Dilley LC, McAuley JD. Prosodic patterning in distal speech context: Effects of list intonation and F0 downtrend on perception of proximal prosodic structure. Journal of Phonetics. 2014;46:68–85. [Google Scholar]
- Nam H, Goldstein L, Saltzman E. Dynamical modeling of supragestural timing; Paper presented at the Proceedings of the 10th Laboratory Phonology Conference; Paris, France. 2006. [Google Scholar]
- Olander L, Smith A, Zelaznik HN. Evidence that a motor timing deficit is a factor in the development of stuttering. Journal of Speech, Language and Hearing Research. 2010;53(4):876–886. doi: 10.1044/1092-4388(2009/09-0007). [DOI] [PMC free article] [PubMed] [Google Scholar]
- Packman A, Code C, Onslow M. On the cause of stuttering: Integrating theory with brain and behavioral research. Journal of Neurolinguistics. 2007;20(5):353–362. [Google Scholar]
- Patel AD. Music, language, and the brain. Oxford University Press; 2007. [Google Scholar]
- Port RF. Meter and speech. Journal of Phonetics. 2003;31:599–611. [Google Scholar]
- Povel DJ, Essens P. Perception of temporal patterns. Music Perception. 1985;2(4):411–440. doi: 10.3758/bf03207132. [DOI] [PubMed] [Google Scholar]
- Ratner NB, Silverman S. Parental perceptions of children’s communicative development at stuttering onset. Journal of Speech, Language and Hearing Research. 2000;43(5):1252–1263. doi: 10.1044/jslhr.4305.1252. [DOI] [PubMed] [Google Scholar]
- Rosen S. Temporal information in speech: acoustic, auditory, and linguistic aspects. Philos Trans R Soc Lond B Biol Sci. 1992;336:367–373. doi: 10.1098/rstb.1992.0070. [DOI] [PubMed] [Google Scholar]
- Schwartze M, Kotz SA. A dual-pathway neural architecture for specific temporal prediction. Neuroscience & Biobehavioral Reviews. 2013;37(10):2587–2596. doi: 10.1016/j.neubiorev.2013.08.005. [DOI] [PubMed] [Google Scholar]
- Seery CH, Watkins RV, Mangelsdorf SC, Shigeto A. Subtyping stuttering II: Contributions from language and temperament. J Fluency Disord. 2007;32(3):197–217. doi: 10.1016/j.jfludis.2007.07.001. [DOI] [PMC free article] [PubMed] [Google Scholar]
- Selkirk EO. Phonology and Syntax: The Relation Between Sound and Structure. Cambridge, MA: MIT Press; 1984. [Google Scholar]
- Tilsen S. Multitimescale dynamical interactions between speech rhythm and gesture. Cognitive Science. 2009;33(5):839–879. doi: 10.1111/j.1551-6709.2009.01037.x. [DOI] [PubMed] [Google Scholar]
- Tilsen S. A dynamical model of hierarchical selection and coordination in speech planning. PLoS One. 2013;8(4):e62800. doi: 10.1371/journal.pone.0062800. [DOI] [PMC free article] [PubMed] [Google Scholar]
- Toyomura A, Fujii T, Kuriki S. Effect of external auditory pacing on the neural activity of stuttering speakers. Neuroimage. 2011;57(4):1507–1516. doi: 10.1016/j.neuroimage.2011.05.039. [DOI] [PubMed] [Google Scholar]
- Wagner M, Watson DG. Experimental and theoretical advances in prosody: A review. Language and Cognitive Processes. 2010;25(7–9):905–945. doi: 10.1080/01690961003589492. [DOI] [PMC free article] [PubMed] [Google Scholar]
- Wendahl RW, Cole J. Identification of stuttering during relatively fluent speech. Journal of Speech, Language and Hearing Research. 1961;4(3):281–286. doi: 10.1044/jshr.0403.281. [DOI] [PubMed] [Google Scholar]
- Wilson SM, Saygin AP, Sereno MI, Iacoboni M. Listening to speech activates motor areas involved in speech production. Nature Neuroscience. 2004;7(7):701–702. doi: 10.1038/nn1263. [DOI] [PubMed] [Google Scholar]
- Wingate ME. Foundations of stuttering. San Diego, CA: Academic Press; 2002. [Google Scholar]
- Wohl MT. The electronic metronome-An evaluative study. International Journal of Language & Communication Disorders. 1968;3(1):89–98. doi: 10.3109/13682826809011445. [DOI] [PubMed] [Google Scholar]
- World-Health-Organization. International statistical classification of diseases and related health problems. 2010 Retrieved 4/30/13, from http://apps.who.int/classifications/icd10/browse/2010/en#/F98.5.
- Yairi E, Ambrose NG. Early childhood stuttering I: Persistency and recovery rates. Journal of Speech, Language and Hearing Research. 1999;42(5):1097–1112. doi: 10.1044/jslhr.4205.1097. [DOI] [PubMed] [Google Scholar]
- Zelaznik HN, Smith A, Franz EA. Motor performance of stutterers and nonstutterers on timing and force control tasks. Journal of Motor Behavior. 1994;26(4):340–347. doi: 10.1080/00222895.1994.9941690. [DOI] [PubMed] [Google Scholar]
- Zion Golumbic EM, Poeppel D, Schroeder CE. Temporal context in speech processing and attentional stream selection: A behavioral and neural perspective. Brain Lang. 2012;122(3):151–161. doi: 10.1016/j.bandl.2011.12.010. [DOI] [PMC free article] [PubMed] [Google Scholar]
Associated Data
This section collects any data citations, data availability statements, or supplementary materials included in this article.