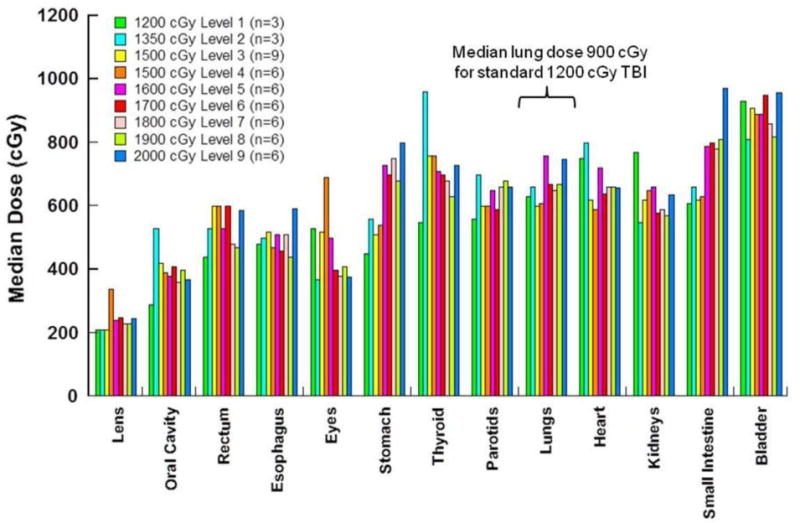
Figure 3. TMLI Median Organ Dose (D50) by Phase I Dose Levels.

Dose levels and number of patients at each dose level are indicated in the legend. The doses plotted are averaged for the patients at each dose level. N=51 total patients treated.

Dose levels and number of patients at each dose level are indicated in the legend. The doses plotted are averaged for the patients at each dose level. N=51 total patients treated.